If you remember, the 12 Days of FME contest for 2024 has a special prize for data visualization. The idea is to download some of the data from the contest and (preferably using FME) analyze it and visualize it. The best visualization wins a US$100 gift card!
It just occurred to us that you don’t even need to have launched a balloon! You can do a visualization anyway! This part of the contest is open to anyone.
So, this thread is where I suggest you post your visualization entries. It might be a simple image, a link to an online map, a video animation, or…. anything you can think of.
Here are some ideas I came up with. Feel free to use any of these, or create your own:
Did any balloons crash into each other? I didn't test for that. If not, what was the smallest distance between two balloons? Assume that a balloon is 20m in diameter and 30m in height.
Can you visualize who did the best airport avoidance? i.e. who would have crossed over an airport, if they had not made a command to change direction?
Can you calculate who did the most efficient route? i.e. distance travelled vs straight line distance between the start and end points. Beware the dreaded 180 meridian!
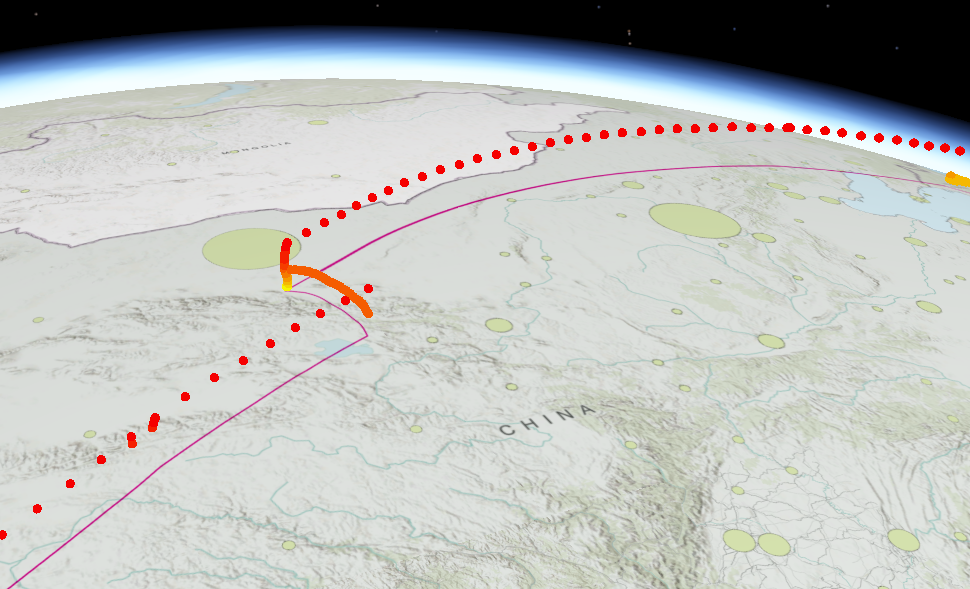
Can you visualize the data over time? For example, to show a route in an animated fashion?
Can you create any interesting maps from the balloon data? Maybe a heat map of balloon tracks? A map of the most crossed countries?
Can you map the balloons of the top half of the leaderboard in comparison to the bottom half? Did launch location affect the results? Were some balloons doomed to lose as soon as they took off?
How about a graph of team registrations? Total and per day? All of this information is available if you mine the data downloads closely enough.
Also, check out this week’s Question of the Week. I believe there may be some more ideas there.
Thanks for taking part. We’re really looking forward to seeing what you can come up with!
Regards
Mark
Page 1 / 2
Thanks for sharing @mark2atsafe! Yes, entries posted on this thread or the Question of the Week will be included in the data visualization contest draw
I made a map showing the nationality of the first hot air balloon to arrive in each territory. The data is updated today (Dec 17), and the multipolygon countries have been split into individual polygons to make the map clearer.
I have also attached my workspace, and anyone can use it freely for any purpose they want.
Submitting our latest version for review. I like the suggestions above. Especially the Heatmap. I think that would look stellar. I might add a couple of suggestions.
I hope your balloon is doing well! Team TRCA here sharing out our dashboard. The dashboard replicates and summarizes most of the data we get from the webhook and downloads and is used for flight planning and checking in.
Clicking on the balloon position dots gives you stats and 3 altitude links to Windy at that location. Good for planning.
Added a list picker on the right hand side. Can click on the Team Name to highlight the current location of a balloon. This function also highlights the countries flownover by that Team’s Balloon. That was a suggestion from Geomancer. I think that is fun.
I included a crude Altitude Profile. Clicking on the balloon position takes you to that point.
Updates are done using 2 workflows published to FME Flow. 1st is automatic triggered on the hour and updates are Track Line and Positions using the webhook. 2nd is a manual push of data downloaded from the Download Menu. GeoJSON package that includes Balloon Events and Balloon Positions updates All the other team balloon positions, stats, points, Event Messages and the location of our Current Position Polygon.
...more to come…. :D
I created a map to illustrate the arrive day and time of each country visited by the balloon of Team 120: SamanthaNI.
Team Evoteck Balloon Tracker (Team ID = 87) Hi Everyone, checkout Team Evoteck (Team ID = 87) Balloon Travel Tracker Map. The map was created using the Contest data of Balloon Position, Country Boundaries and Continent Boundaries. The green line is the Evoteck Balloon travel track across countries and continents.
With FME, QGIS, and Python (imageio library), I created an animated GIF of the balloon positions and their heights during the contest! Can you distinguish your own balloon? :-)
I spend some time creating a workspace to predict the trajectory of any balloon using the webhook. Running the Workspace with the FME Quick Translator turned out to be particularly useful. For visualization I chose my favourite "gis" viewer the FME Data Inspector!
Some of the features I build in the workspace:
Trajectory extrapolation using two methods: LineExtender and ArcEstimator
WebpageOpener custom transformer to open windy.com in a browser on the current coordinates on high zoom level
Feel free to check out the workspace
@geoleo I was trying to open the attached workflow, but i’ts showing me this error.
Submitting our latest version for review. I like the suggestions above. Especially the Heatmap. I think that would look stellar. I might add a couple of suggestions.
I hope your balloon is doing well! Team TRCA here sharing out our dashboard. The dashboard replicates and summarizes most of the data we get from the webhook and downloads and is used for flight planning and checking in.
Clicking on the balloon position dots gives you stats and 3 altitude links to Windy at that location. Good for planning.
Added a list picker on the right hand side. Can click on the Team Name to highlight the current location of a balloon. This function also highlights the countries flownover by that Team’s Balloon. That was a suggestion from Geomancer. I think that is fun.
I included a crude Altitude Profile. Clicking on the balloon position takes you to that point.
Updates are done using 2 workflows published to FME Flow. 1st is automatic triggered on the hour and updates are Track Line and Positions using the webhook. 2nd is a manual push of data downloaded from the Download Menu. GeoJSON package that includes Balloon Events and Balloon Positions updates All the other team balloon positions, stats, points, Event Messages and the location of our Current Position Polygon.
...more to come…. :D
I calculated everyone’s Loopdeloop Score How many times we crossed our own balloon flight path using the Intersector Transformer. Check out your Teams score in the search.
Hi everyone! This is a graphic I made in FME using the ImageRasterizer of the flight path of my balloon ( number 187 ) Bola Azul. On December 11, I found my balloon quickly approaching the Korean peninsula and the vast Pacific Ocean beyond. And for some reason I though I should try to go for Australia instead! Six days later, I almost made it to Indonesia. Oh, so close! LOL
Thanks to the FME team for putting on this contest and to all the other pilots!!!
Hi everyone! This is a graphic I made in FME using the ImageRasterizer of the flight path of my balloon ( number 187 ) Bola Azul. On December 11, I found my ballon quickly approaching the Korean peninsula and the vast Pacific Ocean beyond. And for some reason I though I should try to go for Australia instead! Six days later, I almost made it to Indonesia. Oh, so close! LOL
Thanks to the FME team for putting on this contest and to all the other pilots!!!
But you were the first (if not the only) who got to the Philippines and to Malaysia, so that was really cool to watch.
@evoteck I used FME Form 2024.1.3 to create this workspace, if you can install 2024.1.3 or a newer version of FME Form and you should be able to see the workspace without warnings
@geoleo I have installed the FME Form 2024.13 and I am able to see your great work… You did well.
@krist I observed that you highlighted each country polygon that your Balloon passed through, that’s a great job.
Thanks. The magenta countries are the ones my balloon past over. The purple countries are those that the balloon was with in 50 km of flying over.
A little fun with the data in 3d. Visual path on the ground and altitude shown above for the 3 balloons from our office participants. Simple workbench to isolate the 3 balloon’s of interest data from CSV to gdb.
Airport dodging.
A globe would be a nice addition to the game instead of flat earth !
I made a very hasty map of only the flight paths to simulate the surface of the earth, with mine highlighted in red.
I wanted to have a visual of what it would be like to fly the balloon. I create a workspace the turns one call sign’s trip into a google earth tour. Animations in KML are not my friend, I spent far too much time getting the speedometer to work, that I wasn’t able to include the events and score as originally planned. These are best viewed with the overview map enabled.
I give you my trip (C-8EE), Mark Ireland’s (C-L7W) and the winner Cloudchasher (G-IVH).
Hi everyone, Here is another update from Team Evoteck..
12 Days of FME Contest Visualization Presentation by Team Evoteck (Team ID = 87). This visualization shows the Balloons Travelled Difference Between Top-half Leaderboard VS Bottom-half Leaderboard.
I Utilized the contest data of all the balloon position, in which I used FME Workflow with the Feature_Merger Transformer to merge the Top-half listed Leaderboard balloons position and also merged the Bottom-half listed Leaderboard balloons position.
After getting 2 shapefile of merged files, I utilized QGIS (Timemanager) plugin to create the animation effect to show the color difference when the animation effect occurs.
The green line is for balloons that fall within top-half in the Leaderboard list, while the red line is for balloons that fall within bottom-half in the Leaderboard list.
Feel free to check if your balloon falls within top or bottom - half in the leaderboard.
Also feel free to download the animated visualization map as a GIF image below.
We created a (simple) Experience in ArcGIS Online, from where we could also call two FME Workspace Apps. One to change the altitude (the same one as on the 12 Days of FME page) and one for forecasting routes based on a weather API from meteomatics. Even though their forecasts didn't match the API that was used by the contest (or used different times from the forecast), it was interesting to work with the data. We also created a warning system using Twilio (thanks @redgeographics for the hint somewhere else in the community). Everytime you would come within a 2h range of an airport buffer, you would receive a WhatsApp message. We even designed it in such a way that you could add planned route points, where you want to change altitude, and get a warning when you are within 2h of the planned command.
So, not really a visualization with all the results, but a dashboard to work with during the contest.
The Experience can be viewed by everyone.
Hi, I found the question of airport avoidance to be of interest, as I suspected I would myself be on such a list. This I later found to be true, I was in place 24 on this achievment list.
This was accomplished by matching the commands for changing altitude closest before a position for each balloon. I used a 0.1 degree buffer around airports to find the commands of interest in this particular case. Those were then matched to events where airports were hit to exclude the matches where avoidance was not achieved. The result being the enclosed map produced in ArcGIS Pro with data exported from FME. The map shows the most avoided airports by number as well as a table of the 20 top airport avoiding teams, along with som specifics for these balloons. This “only” shows the most airport avoidances, not taking into account avoidance effectiveness. It is indeed theoretically possible that the top ones on this list also hit the most airports...
This was one fun event!
Edit: I had included duplicates in the matches, now those are excluded. Thanks @jonas_nelson for feedback!
A quick screenshot of my pdf map:
@larsatomkeere I am really impressed with the Dashboard development. Great job
@jfisch25 I feel happy to see that the hasty map shows the movement of the balloon in a globe shape form.