Question

Statistic report on Rolling 12 Months

  • November 27, 2019
  • 3 replies
  • 11 views

Forum|alt.badge.img

Dear All ,

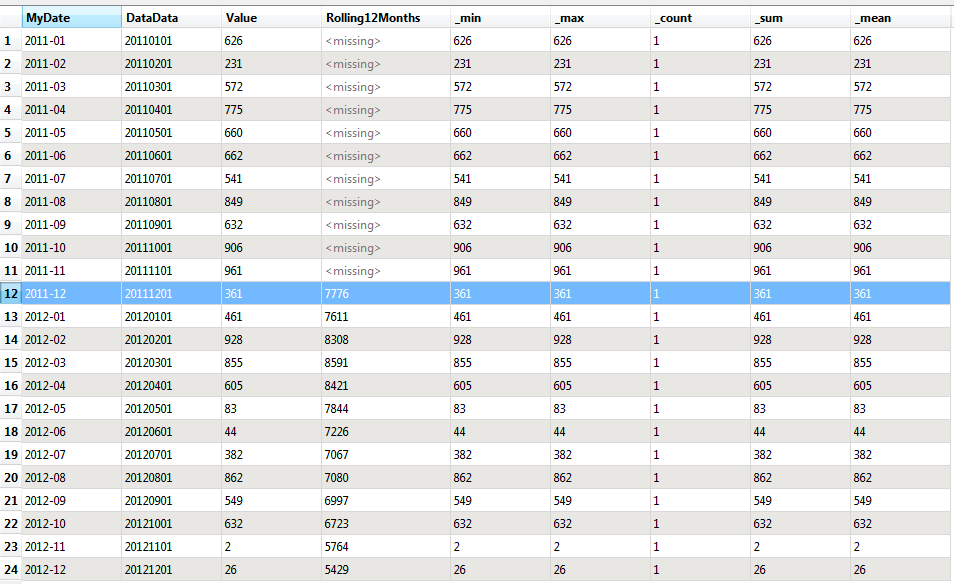
How to do statistic report on on rolling 12 month basis , e.g on 1/1/2019 , we need the sum and count from 1/1/2018 till 1/1/2019 and so on .

Thanks ,

3 replies

ebygomm
Influencer
Forum|alt.badge.img+39
  • Influencer
  • November 27, 2019

I would

  1. Create a new attribute with the date converted to a month/year format only, e.g. 1/2018.
  2. Ensure that your data is sorted in date order
  3. Send to the statistics calculator with a group by on the newly created month year attribute
  4. Use the cumulative output (be aware that there may be a workaround required to get round an issue with the statistics calculator)

https://knowledge.safe.com/questions/102959/incorrect-results-from-statisticscalculators-cumul.html


Forum|alt.badge.img
  • Author
  • November 27, 2019

Thanks @ebygomm for the support but it is not adding the previous month . the output should be as rolling12month output


ebygomm
Influencer
Forum|alt.badge.img+39
  • Influencer
  • November 27, 2019
khalid_omer wrote:

Thanks @ebygomm for the support but it is not adding the previous month . the output should be as rolling12month output

I misread, I think you don't need the group by at all in that case, and then just keep the output for the first of each month


Cookie policy

We use cookies to enhance and personalize your experience. If you accept you agree to our full cookie policy. Learn more about our cookies.

 
Cookie settings