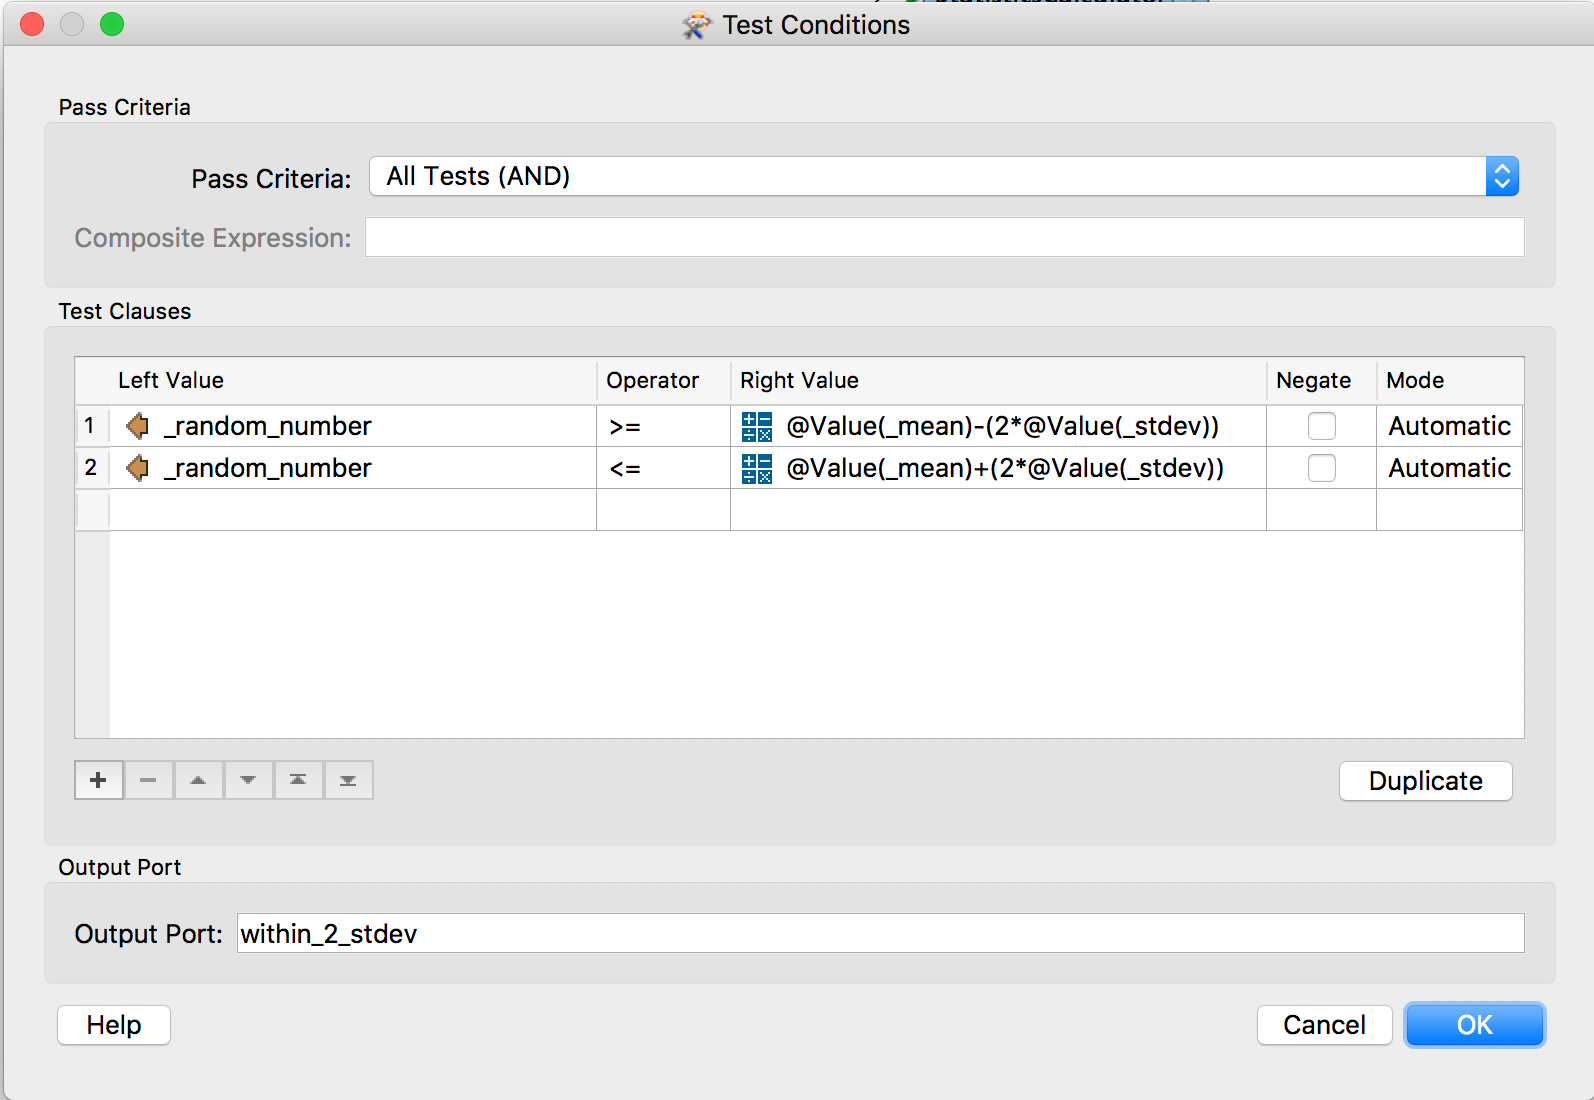
I have a vector dataset containing buildings and a raster dataset containing elevation data.

I am looking for a way to find the mean and maximum value of the roof of each building.

So far I have converted the raster dataset to points, extracted the raster value to an attribute and clipped it with the building polygons. The StatisticsCalculator can help me finding the mean and max value in each building, but before doing that, I would like to remove the outliers.

So the question is: how can I remove the top and bottom 5% of the values in a list?
The StatisticsCalculator can also calculate the standard deviation. In a random sample you would expect 95% of the values to be within 2 standard deviations of the mean. If you filter the rest out you will probably have gotten rid of the most extreme outliers.


Totally agree with redgeographics! Another way might be to set a maximum and use a TestFilter to filter out everything larger than your maximum parameter. This can have major consequences, so I still advice you to use the approach with the StatisticsCalculator.


The StatisticsCalculator can also calculate the standard deviation. In a random sample you would expect 95% of the values to be within 2 standard deviations of the mean. If you filter the rest out you will probably have gotten rid of the most extreme outliers.

Thanks for the answer.


How do I filter the 5% out? Do I use the TestFilter? I can't get it to work with lists, so I welcome any suggestions.


Thanks for the answer.


How do I filter the 5% out? Do I use the TestFilter? I can't get it to work with lists, so I welcome any suggestions.


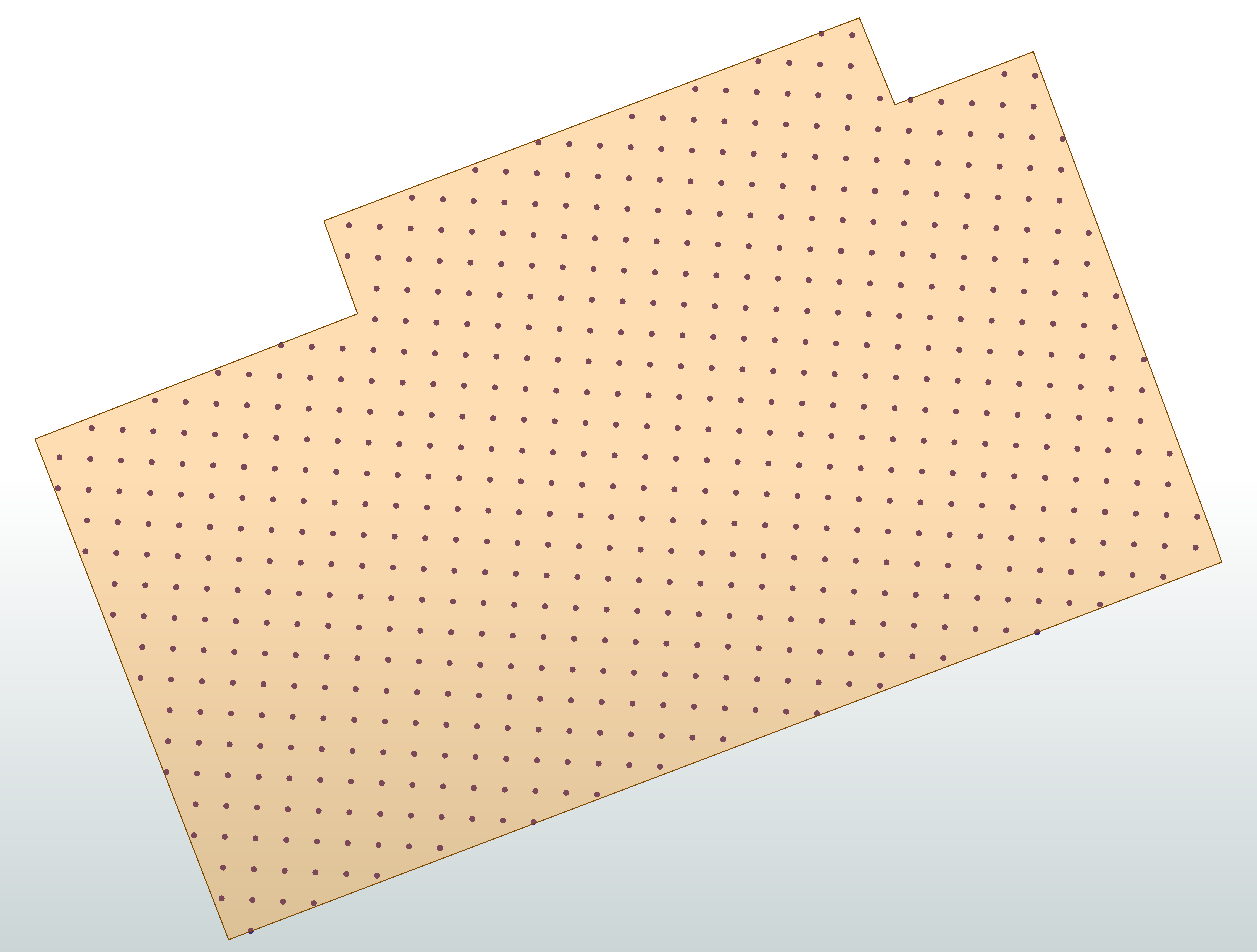
This should do it. I quickly tested it with a bunch of random numbers (which obviously don't follow normal distribution), you would be testing the z-values.


The StatisticsCalculator can also calculate the standard deviation. In a random sample you would expect 95% of the values to be within 2 standard deviations of the mean. If you filter the rest out you will probably have gotten rid of the most extreme outliers.

This works with attributes, but not with lists. Should I convert the list to attributes before running the TestFilter?


This works with attributes, but not with lists. Should I convert the list to attributes before running the TestFilter?


Yes: ListExploder to turn the list into features, then that Testfilter and then if you want you can rebuild the list again.


Yes: ListExploder to turn the list into features, then that Testfilter and then if you want you can rebuild the list again.


Perfect! Thanks :)


The StatisticsCalculator can also calculate the standard deviation. In a random sample you would expect 95% of the values to be within 2 standard deviations of the mean. If you filter the rest out you will probably have gotten rid of the most extreme outliers.

Note: you can say that approximately 95% points are within the range between (mean - stdev x 2) and (mean + stdev x 2) only if the distribution of elevation of the points can be considered as the standard normal distribution.


See also here: Normal distribution | Wikipedia


Reply