Hi @rob14
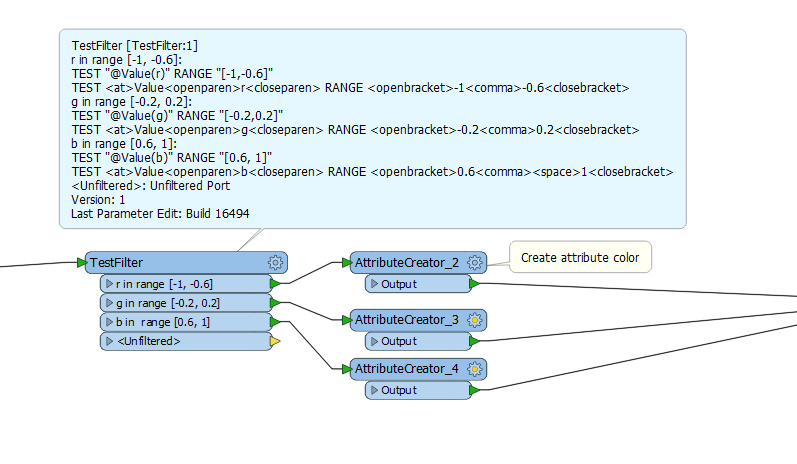
I think you can solve this issue with a basic TestFilter and some AttributeCreators or combine everything in an AttributeManager with conditional values.
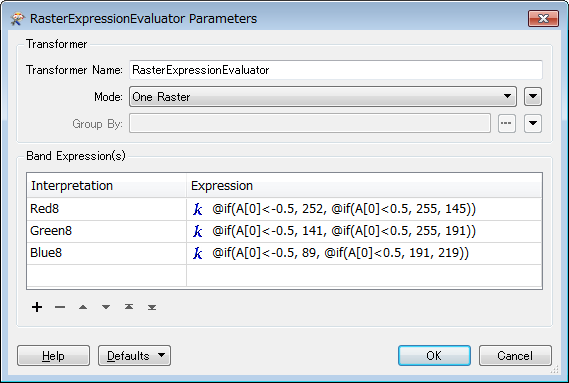
Hi @rob14, how many colors do you need to define? If the number of colors is not so large, I would transform the source raster into RGB color raster with the RasterExpressionEvaluator and then generate a palette with the RasterPaletteGenerator.
[Addition] e.g. if you need only three colors:
Hi @takashi and @jeroenstiers
Thanks you both for the workflows whci you sent, these are the type of thing which I was interested to know. As I was unaware as to the method to create a range clause for a raster value.
At present I do not know the number of classes which I will potemntially require, therefore these alternate methods will provide me with some options.
Regards,
Rob
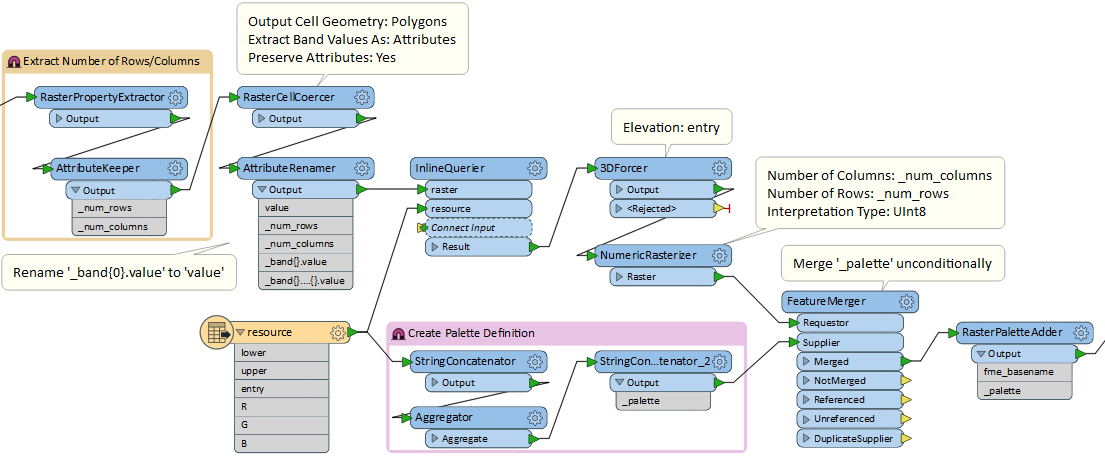
If you have created an external table which defines the mapping rules between value ranges and palette entries, e.g. "resource.csv":
lower,upper,entry,R,G,B
-1.0,-0.6,0,100,240,240
-0.6,-0.2,1,140,180,220
-0.2,0.2,2,180,100,180
0.2,0.6,3,220,180,140
0.6,1.1,4,240,240,100
this workflow might work for you.
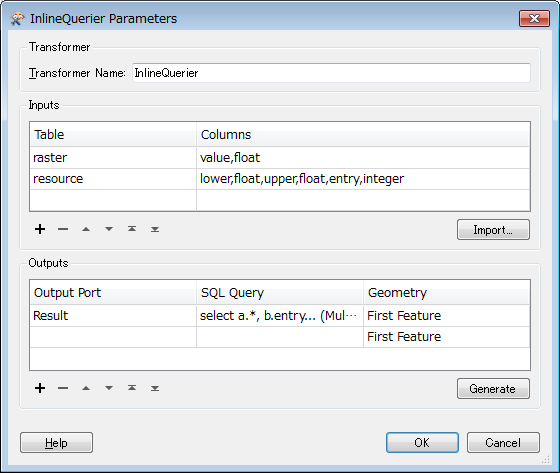
SQL Query:
select a.*, b.entry
from raster as a inner join resource as b
on b.lower <= a.value and a.value < b.upper
Palette: the transformers within the lower bookmark create this text as an attribute called '_palette'.
RGB24
0 100,240,240
1 140,180,220
2 180,100,180
3 220,180,140
4 240,240,100
Regarding palette definition, see the help doc on the RasterPaletteExtractor transformer.
Hope this helps.
Hi @takashi
Thanks for the revised workflow, I am sure that I will need to implement more that 2 or 3 ranges. Therefore your new workflow will provide greater flexibility. I am in the process of working on the stages before the visualisation. I will let you know how I get on with the visualisation element.
Regards,
Rob
Reminded me a similar question. This Q&A; could also be a hint.
Classify raster data by breakpoints
Reminded me a similar question. This Q&A; could also be a hint.
Classify raster data by breakpoints
Hi @takashi,
Thanks for the additional link to the breakpoints post.
This is another interesting way to achieve the visualisation, and exactly what I was after.
I spent some time last night working on and understanding the nested if statements, and have devised my breakpoints (about 12). I used a graduation of only r values (0-225) to visualise but having seen this other example I think that the 'reclassing' example with additional palette creation will allow of greater visual clarity.
In addition/out of interest; I presume that you could also use this technique to actually reclass a raster using user defined ranges if you wanted to? And then subsequently split out into the revised classes? I only ask as I have a floating point raster which I am going to have to do this for i.e. something similar to NDVI splitting.
Regards,
Rob