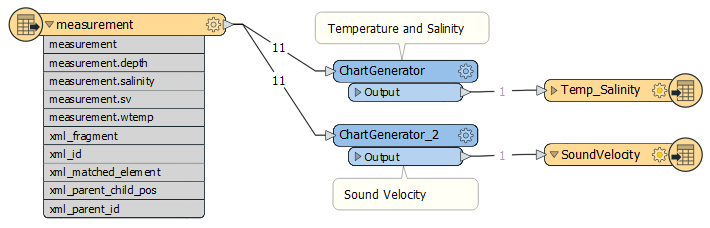
I am trying to parse an XML file to generate a chart. I am not exactly sure how do do this and could use some help. These should be data series line graph of temperature, salinity, and sound velocity by water depth.
Here is an xml example file!

I am trying to parse an XML file to generate a chart. I am not exactly sure how do do this and could use some help. These should be data series line graph of temperature, salinity, and sound velocity by water depth.
Here is an xml example file!
Enter your E-mail address. We'll send you an e-mail with instructions to reset your password.