Question

Most used Transformers and Formats

  • May 15, 2020
  • 4 replies
  • 402 views

sigtill
Supporter
Forum|alt.badge.img+25

I found this list of most used Transformers (https://knowledge.safe.com/questions/2367/most-used-transformer.html ) but is there a list of most used Formats also?

This post is closed to further activity.
It may be an old question, an answered question, an implemented idea, or a notification-only post.
Please check post dates before relying on any information in a question or answer.
For follow-up or related questions, please post a new question or idea.
If there is a genuine update to be made, please contact us and request that the post is reopened.

4 replies

Forum|alt.badge.img+2
  • 194 replies
  • May 15, 2020

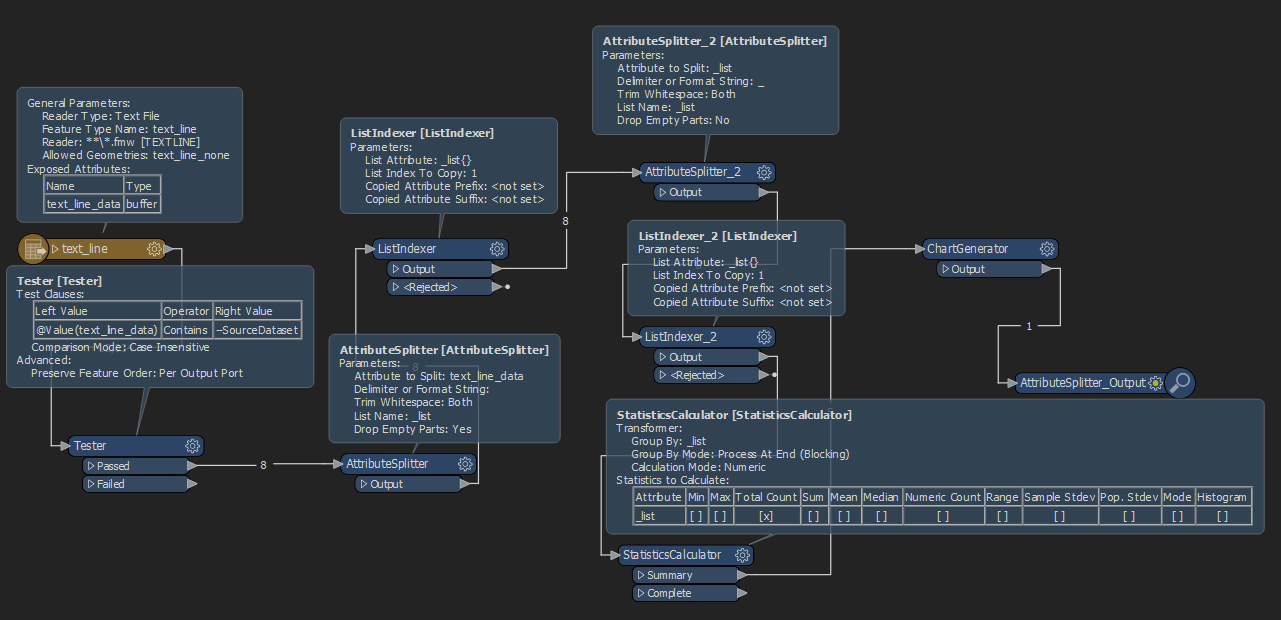
Each person/company/entity will have vastly different results. It's pretty easy to do for your personal projects. (attached .fmw)


If you open a FMW file in notepad you will see the sources for whatever workbench you have opened;

# --SourceDataset_MSSQL_SPATIAL NonGeodatabase

# --DestDataset_SHAPE C:\\***


Then you can add all .fmw files to FME as a wildcard input, test out the sources, clean up the data, run stats, and then create a chart.


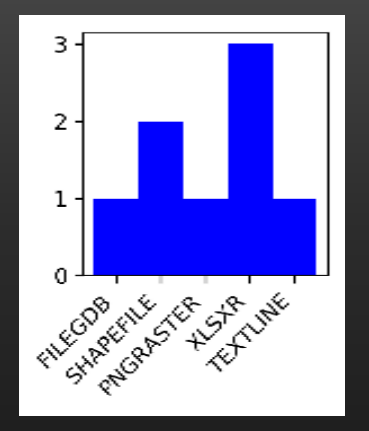
Example output


Chart_inputs.fmw


mark2atsafe
Safer
Forum|alt.badge.img+56
  • Safer
  • 2554 replies
  • May 15, 2020

Well the transformers page is listed in order of most-used, although it doesn't have any numbers or percentages:

https://www.safe.com/transformers/

The formats page (https://www.safe.com/integrate/) doesn't have that same facility. The top 4 will likely be Shapefile, AutoCAD DWG, CSV, Excel; but beyond that I really don't know.

I can't find a whole list, but if there's a format of interest, I can look it up.


Forum|alt.badge.img+2
  • 1891 replies
  • May 15, 2020

@sigtill If you can encourage your customers to run the FME Workspace Statistics you'll get very good picture of what they are using. The example results in that article show statistics for most of the webinars we have presented.


Forum|alt.badge.img+2
  • 1891 replies
  • May 19, 2020

Each person/company/entity will have vastly different results. It's pretty easy to do for your personal projects. (attached .fmw)


If you open a FMW file in notepad you will see the sources for whatever workbench you have opened;

# --SourceDataset_MSSQL_SPATIAL NonGeodatabase

# --DestDataset_SHAPE C:\\***


Then you can add all .fmw files to FME as a wildcard input, test out the sources, clean up the data, run stats, and then create a chart.


Example output


Chart_inputs.fmw

@jlbaker2779 Try the FME Workspace FMW reader. this is used in the statistics workspace I referenced ( FME Workspace Statistics ) and would also allow you to pull the formats used in FeatureReader/Writer, DatabaseJoiner etc.