Hi,
I've been trying to convert a JSON time series dataset into spreadsheet using
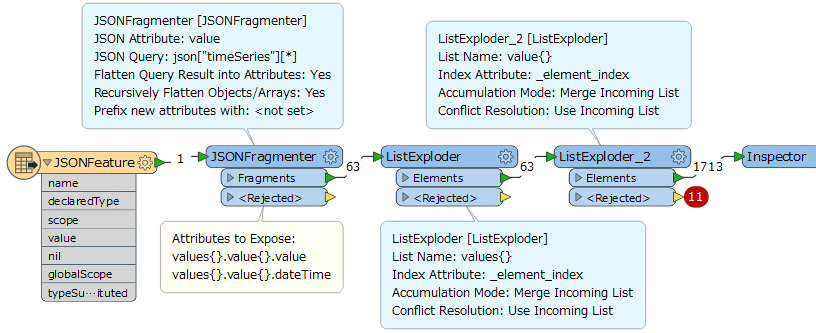
FME Desktop for the last few days and am having some trouble getting the full time series to come out of the process. I can get the first record out of the dataset, (or second, etc.) by just adding value{0}.value and value{0}.dateTime in the AttributeManager, along with all of the other static data for the station (lat/long, name, site code, etc.). The current workflow correctly writes the output to excel, but I need the static data to repeat and the full list of value/dateTime records to be written. If I add a ListBuilder in front of the AttributeManager, then nothing comes through and all that's written to output are the field names. I think that the ListBuilder is probably the key here, as it lets me add a range of indexes for the time series data (i.e - value{0-100}.dateTime), but there's no output when I do this and I think I need a little guidance. A side question here: if ListBuilder is the right function, then is it best to just enter a upper limit to the array sequence that is beyond the length of the time series (i.e. 0-366 for a year of daily averages)?
Additionally, whenever I try to expose attributes using JSONFlattener, the ListExploder rejects anything below the second from top node ("timeSeries"), and there is no clear message in the log output.
There is a JSON url in the JSONFeature reader that is representative of the data set.


