Question

How to visualize chart data using a color ramp?


limo
Supporter
Forum|alt.badge.img+8
  • Supporter

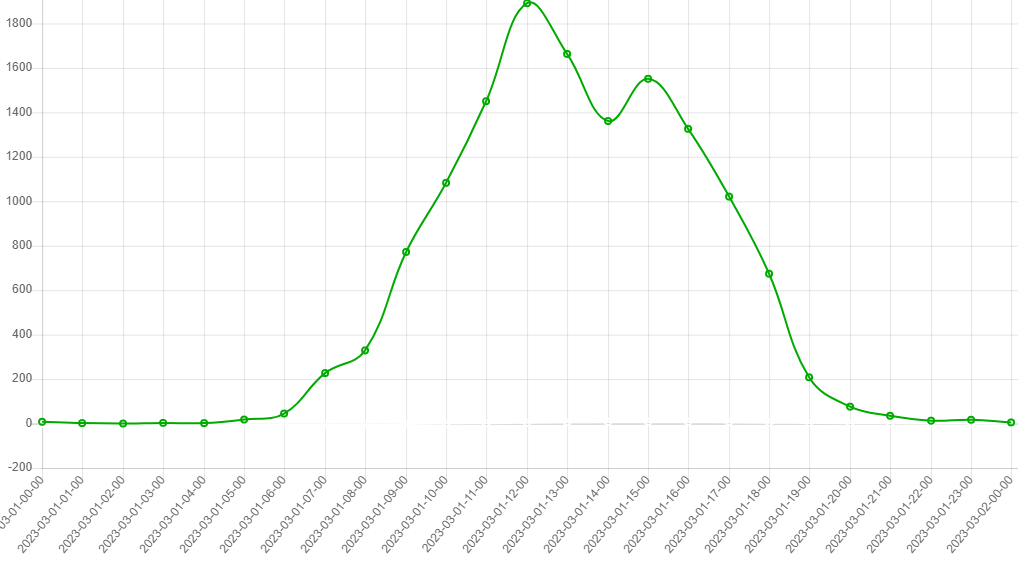
We have generated a chart by using the transformer "HTMLReportGenerator".

As result we have something like this:

image.png
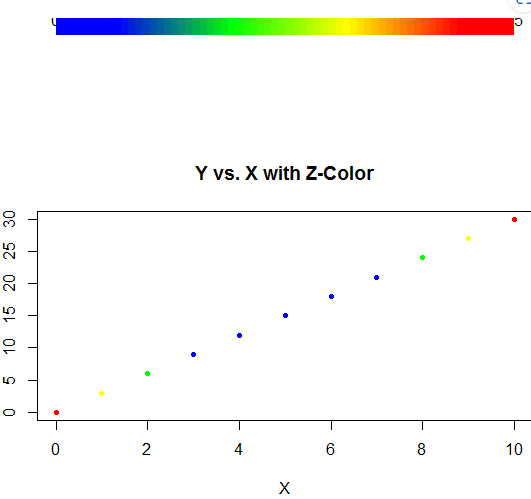
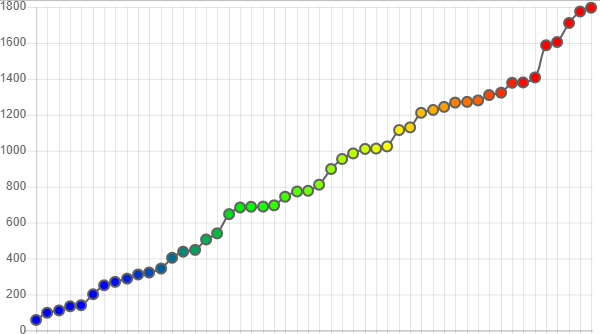
Now we wanna color each data point inside the chart differently. Something like this:

image 

In fme I can only choose one color for the hole data atribute!

Is it piossible to create different colors for one data attribute?


3 replies

ebygomm
Influencer
Forum|alt.badge.img+31
  • Influencer
  • April 14, 2023

It can be done, but requires fiddling with the HTML output and it's not particularly straightforward

image


limo
Supporter
Forum|alt.badge.img+8
  • Author
  • Supporter
  • April 17, 2023

how did you do that?

I know that the transformer "HTMLReportGenerator" allows only one color for the data attribute!


ebygomm
Influencer
Forum|alt.badge.img+31
  • Influencer
  • April 17, 2023

If you can create a comma separated string of RGB values representing colours for each of your points, you can then use a string replacer after the report generator to do something like this

image
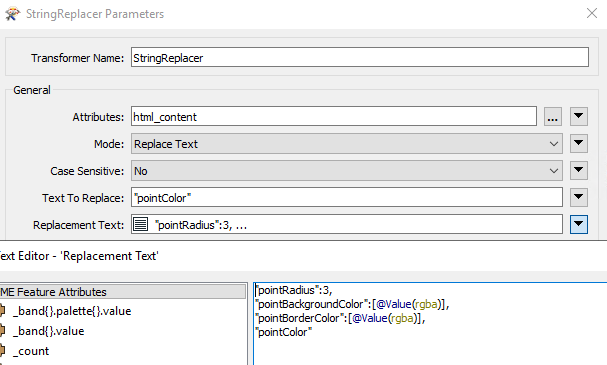
Example rgba attribute

"rgba(0,3,251,255)","rgba(0,1,250,255)","rgba(0,1,250,255)","rgba(0,1,250,255)","rgba(0,1,250,255)","rgba(0,1,250,255)","rgba(0,1,250,255)","rgba(2,14,240,255)","rgba(0,30,223,255)"


Cookie policy

We use cookies to enhance and personalize your experience. If you accept you agree to our full cookie policy. Learn more about our cookies.

 
Cookie settings