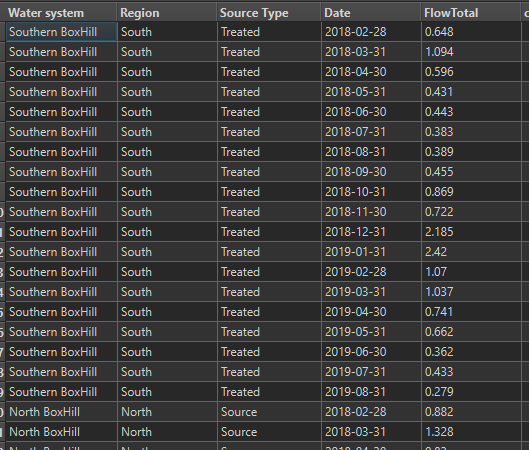
I currently have a dataset, see top half of picture below, that I wish to transform/transpose into the format that can be seen in the bottom half of the image. The blue/green/peach coloured fields are date/measurement.


Data example, top half is current data, bottom half is desired output 

I am totally unsure of where to begin with this, the current transposer tools seem to only be able to do simple transposing without adding the additional rows of location/sourcetype/date/measurement I need. As can be seen I want to make a individual row for each date/measurement combination.


I have also attached sample data in xlsx and csv.


Any help would be appreciated!

One way to do this is to explode the attributes into features and create Date and FlowTotal from _attr_name and _attr_value. Added sample workspace demonstrating this.


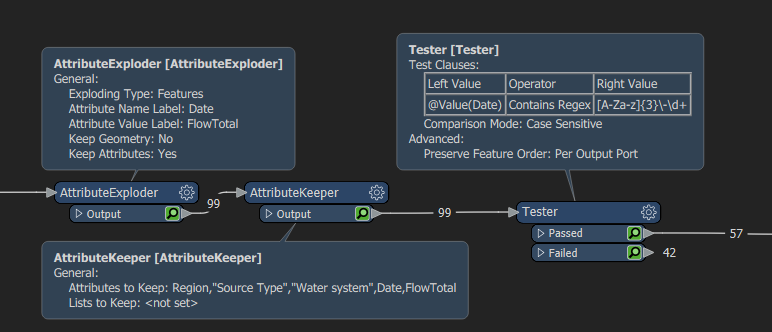
This sort of workflow should work here

AttributeExploder keeping the Attributes, followed by keeping only the relevant attributes, followed by keeping only those features where the Date field contain something in the format Apr-19

imageYou then probably need to do some date formatting to get the date in your preferred format
image


One way to do this is to explode the attributes into features and create Date and FlowTotal from _attr_name and _attr_value. Added sample workspace demonstrating this.

This worked great! The attribute exploders did exactly what was needed in this situation. Thank you!


This sort of workflow should work here

AttributeExploder keeping the Attributes, followed by keeping only the relevant attributes, followed by keeping only those features where the Date field contain something in the format Apr-19

imageYou then probably need to do some date formatting to get the date in your preferred format

image

Great! Thank you for your answer, the attribute exploder was the key to getting this done!


Reply