Solved

How to pad data in a table with missing ranges?


Hello all, I have a table that I need to pad with missing ranges following a small, specific rule set.


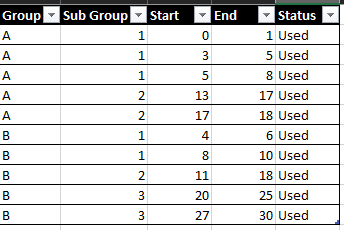
Lets say I have the following table (in the attached spreadsheet):

Screenshot_1
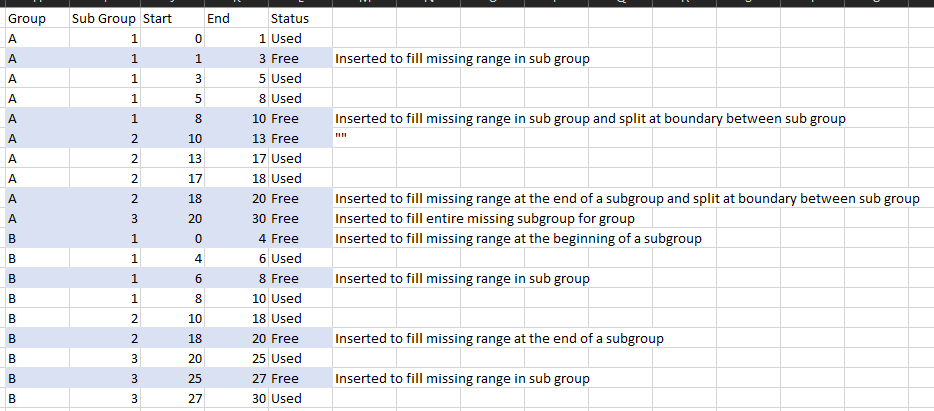
I would like to result in this table, which has new rows inserted with start and end values whos ranges were not represented in the initial table. These new rows have been flagged as "free" (also in the attached spreadsheet):

Screenshot_2The knowns and the rules are as follows:

  1. The quantity of groups is not known
  2. The quantity of subgroups is known, in this case 1,2,3
  3. The allowed range is known for each subgroup, in this case 0-10, 10-20, 20-30
  4. As a rule, ranges should not cross subgroup boundaries (see row 9 in output table)
  5. All values from 0 to 30 should be represented in each group


To simplify the example, the ranges overlap. The real data type has decimal precision, which would result in the following ranges:

0 <= SUBGROUP1 < 10

10 <= SUBGROUP2 <20

20 <= SUBGROUP3 <=30


Thank you in advance for the help.

Best answer by debbiatsafe

Hi @goskoog​ 

I'm not certain this is the most efficient way but you can approach the issue from a spatial perspective--eg. finding gaps along a line that spans the range of values (0-30). Once you have identified the gaps, you can then split those gaps at the subgroup boundaries.

I have attached an example workspace demonstrating this approach. I don't fully understand the Sub Group requirements so you will have to make some changes (see Group A feature where Start = 8 and End = 10 of output).

I hope this helps.

View original
Did this help you find an answer to your question?

2 replies

debbiatsafe
Safer
Forum|alt.badge.img+20
  • Safer
  • Best Answer
  • March 2, 2021

Hi @goskoog​ 

I'm not certain this is the most efficient way but you can approach the issue from a spatial perspective--eg. finding gaps along a line that spans the range of values (0-30). Once you have identified the gaps, you can then split those gaps at the subgroup boundaries.

I have attached an example workspace demonstrating this approach. I don't fully understand the Sub Group requirements so you will have to make some changes (see Group A feature where Start = 8 and End = 10 of output).

I hope this helps.


  • Author
  • March 2, 2021
debbiatsafe wrote:

Hi @goskoog​ 

I'm not certain this is the most efficient way but you can approach the issue from a spatial perspective--eg. finding gaps along a line that spans the range of values (0-30). Once you have identified the gaps, you can then split those gaps at the subgroup boundaries.

I have attached an example workspace demonstrating this approach. I don't fully understand the Sub Group requirements so you will have to make some changes (see Group A feature where Start = 8 and End = 10 of output).

I hope this helps.

Hi @debbiatsafe​ 

This solution looks really great, I will test it out today. Thank you.


Cookie policy

We use cookies to enhance and personalize your experience. If you accept you agree to our full cookie policy. Learn more about our cookies.

 
Cookie settings