
I'm following up on this old topic on FMETalk:
https://groups.google.com/forum/#!topic/fmetalk/Uta0qnwj_44
Faced with the same problem, I came to the following solution:
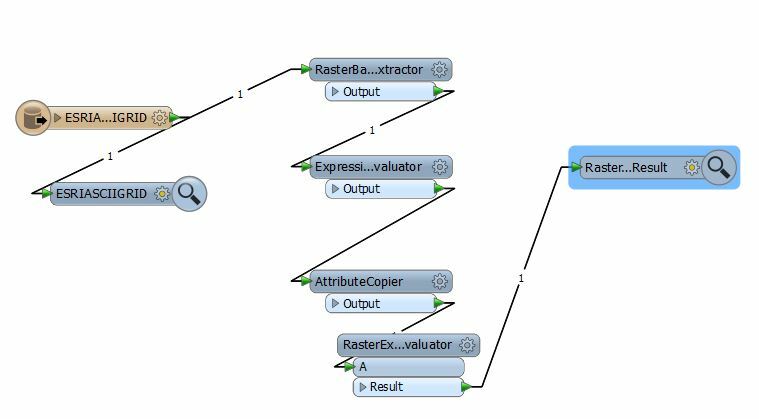
First extract min/max values using a RasterBandMinMaxExtractor
Use AttributeCopier to copy the extracted values to Max and Min attributes
Then use ExpressionEvaluator to compute the Mean attribute value = (Max+Min)*0.5
Finally use RasterExpresssionEvaluator to compute three bands (R, G, B):
- Red16: @if(A[0]<@Value(A:gemiddeldewaarde),65536.0*(A[0]-@Value(A:gemiddeldewaarde))*(@Value(A:Minimum)-@Value(A:gemiddeldewaarde)),0*A[0])
- Green16: @if(A[0]<@Value(A:gemiddeldewaarde),65536.0*(@Value(A:Minimum)-A[0])/(@Value(A:Minimum)-@Value(A:gemiddeldewaarde)),65536.0*(A[0]-@Value(A:Maximum))/(@Value(A:gemiddeldewaarde)-@Value(A:Maximum)))
- Blue16: @if(A[0]<@Value(A:gemiddeldewaarde),0*A[0],65536.0*(A[0]-@Value(A:gemiddeldewaarde))/(@Value(A:Maximum)-@Value(A:gemiddeldewaarde)))
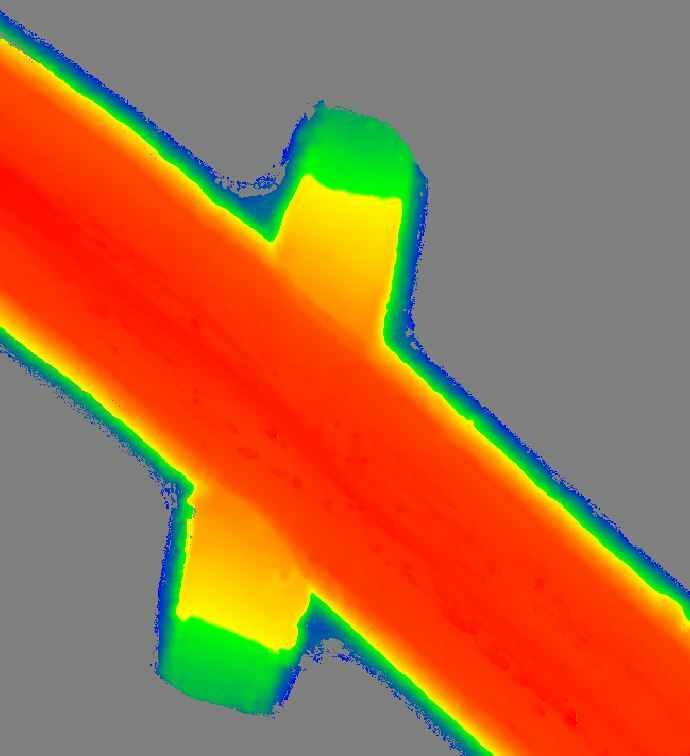
This yields a nice colored image from the REAL64 values by having red values where the raster has minimal values, turning through orange and yellow to green for medium values and further on through turqoise to blue for the high values.
I consider two intervals, from Min to Mean and from Mean to Max. I consider the R, G, B values as a function depending on the height, and compute simple linear parameters given the two height/color points at the ends of the interval. The functions have the form R(h) = A * h + B where R(h) is the Red component, A and B are the parameters for the function and h is de raster value from the original raster.
For the first interval, the function becomes (demanding that the linear goes through the points (Min, 1) and (Mean, 0). Parameter A gets the value 1/(Min - Mean) and B gets the value -Mean/(Min - Mean), so the function for the first interval for the color Red becomes:
R = 65536.0*(h-Mean)/(Min - Mean) (where I added the max. value for Red16 65536.0 since the function runs through Mean, 1). For the second interval the Red part will be 0.0 * h, not plain 0.0. This is essential, since NODATA values should stay NODATA, not become 0.0, i.e., get a color.
In the same way functions for the Green component (running from Min, 0 to Mean, 1 for the first interval and from Mean, 1 to Max, 0 for the second interval) and the Blue component (being 0.0*h for the first interval and running from Mean, 0 to Max, 1) can be computed and yield the formulas above for the RasterExpressionEvaluator. See the images below.