 

Hello Community,


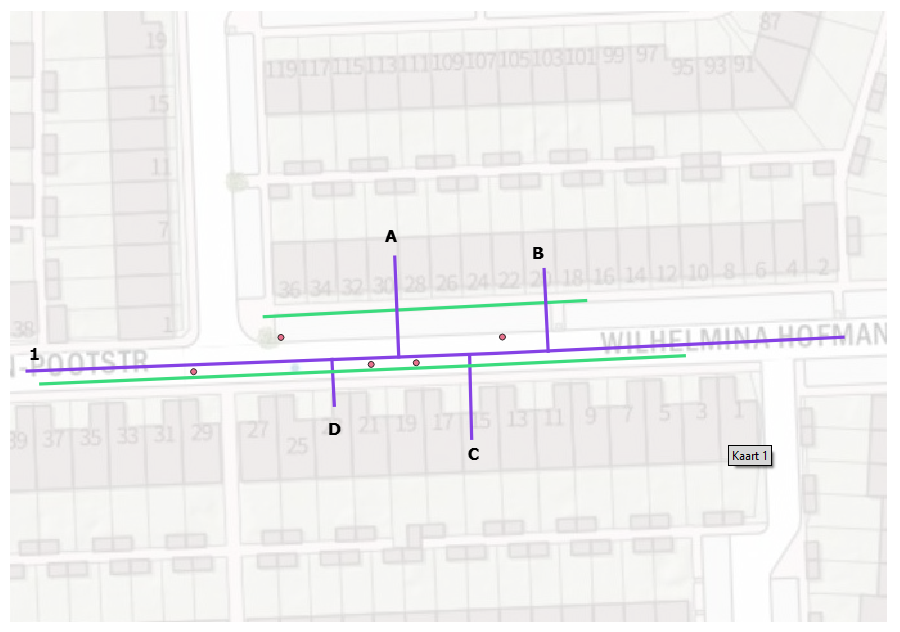
My goal is to find parallel lines (green) and the dots (5 points) of line (1). Line 1 and A,B,C and D belong to the same type in my dataset. A,B,C and D are almost at an angle of 90 degrees of line 1, sometimes it can even be 45 degrees; it's variable. If I use a bufferer all blue lines are processed. How can I exclude the A,B,C and D lines from processing?

Greetings.

It might help to describe the overall problem and solution trying to achieve. To me, it appears that you are trying to find which parts of a utility network are within the bounds of a road pavement?

So then is the problem that you have 3 input datasets:

  • Road boundaries (as Green Lines)
  • Utility Network (Blue Lines)
  • Utility Points (Blue Dots)

...and you wish to find all Blue Lines and Blue Dots within the Green Lines?


Hi @smartman63, a possible way is:

  1. Send the lines (#1, A, B, C, D) into a TopologyBuilder (FME 2019 or later - Generate From: End nodes and Intersections, FME 2018 and earlier - Assume Clean Data: No). This splits the #1 line into some parts at the intersections between #1 and A-D, but A-D won't be split.
  2. Create slender polygons from the resulting Edges with a Bufferer (set a very small value to the Buffer Amount).
  3. Filter the original #1 and A-D lines (Candidate) by the slender polygons (Filter) with a SpatialFilter (Spatial Predicate to Test: Filter Contains Candidate). Only the #1 will be output via the Failed port.

This should work only if the A-D lines touch the #1 line with their end nodes as shown in your screenshot.

Hope this helps.


@smartman63 usually lateral lines or services lines do have an attribute that marks them as being different to the main line. If you have service points at the end of the laterals (ABCD) then you can use the spatialrelator ot spatialfilter to identify them and filter them out.

If you attach a small sample dataset then it helps contributors experiment and sometime create a minimum working example.


find_parallel_example data.zip

Hello again,


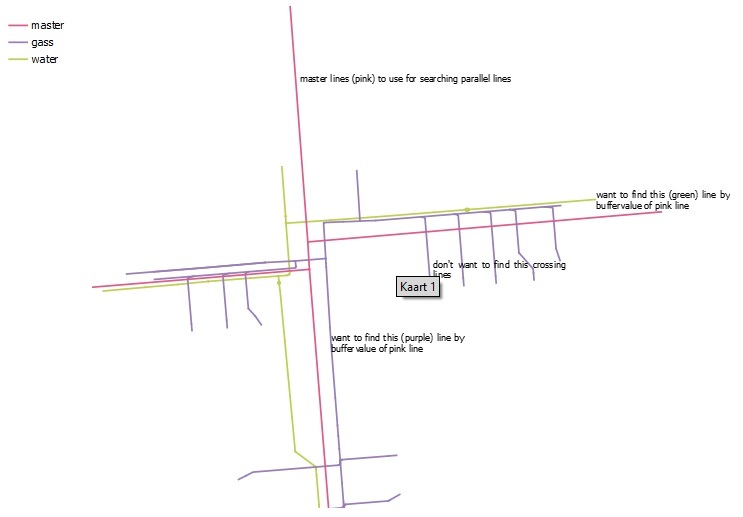
I'm not able to produce a good result. Therefore I included some sample data in shape-format and an image of that data with a little explanation again what I would like to achieve. Hope this helps. Thnxs for all your help.


Reply