

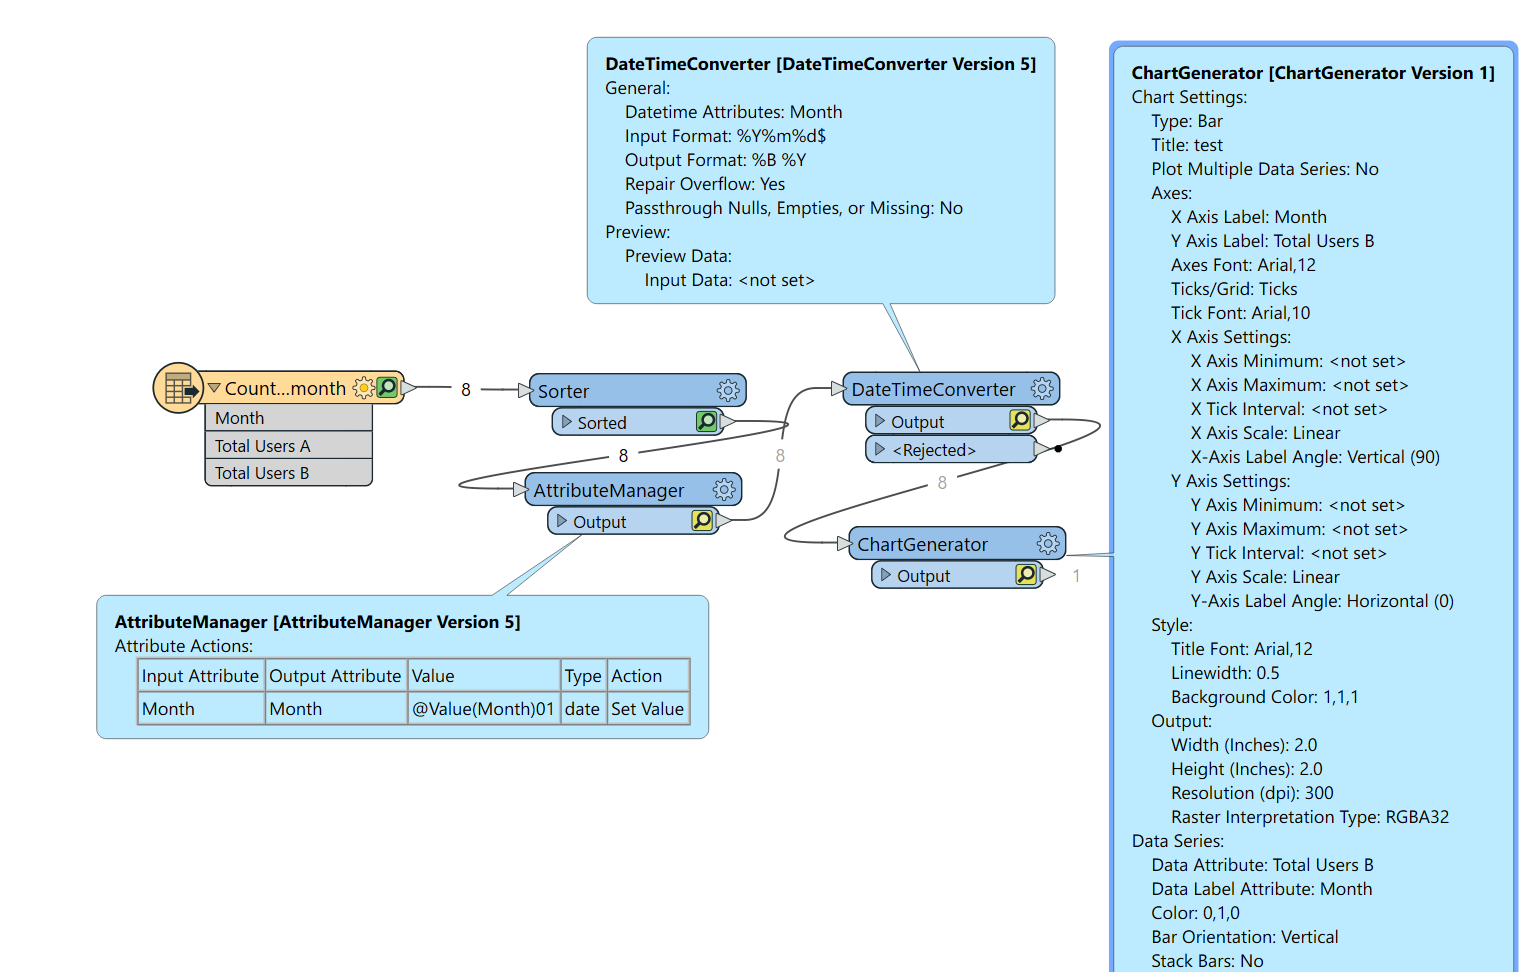
I have yet to successfully use dates as an axis in ChartGenerator. Ideally, I would like to be able to use more natural date formats e.g. %B %Y or %m %Y and set the scale accordingly based upon time increments. Is this possible (in Chart Generator or another transformer) ? Or am I going to need to take it out into PowerBI, Excel, etc?

Question
Dates in charts


Login to the community
No account yet? Create an account
An FME Account is required to contribute
LoginEnter your E-mail address. We'll send you an e-mail with instructions to reset your password.