First off, is there a location where I can download the dashboard pages? Our dashboards seemed to have gone missing.

Secondly, I'm looking for a way to get what is coming out of the JobHistoryReader, but including FME_SERVER_REQUEST_PARAMETERS and FME_SERVER_REQUEST_HEADERS arguments with an FME job so I can run stats and be able to filter stats based on remote address or an application ID that is passed through as a parameter. Has anyone done this or have any idea of how to do it?

Thanks in advance!

Hi @runneals

When you say your Dashboards are missing, do you mean the Dashboards page isn't available from the navigation on the left-hand side of your FME Server interface or that there aren't any dashboards listed when you open the page? If the first, perhaps double-check your permissions. If the second, check if the DashboardStatisticsGathering workspace is running correctly on your server (it should be run as a scheduled job that is disabled by default). Or are your Dashboard-related workspaces missing?


The JobHistoryReader inside the statistics gathering workspace hits this REST API endpoint when it pulls down job information: https://docs.safe.com/fme/html/FME_REST/apidoc/v3/#!/transformations/list_get_19 So everything listed in the Response Class there should be accessible. You may have to expose the corresponding attributes inside the JSONFragmenter in that transformer to be able to work with them. The request parameters are for sure available there, but the REST API doesn't return the Request Headers.


Laura,

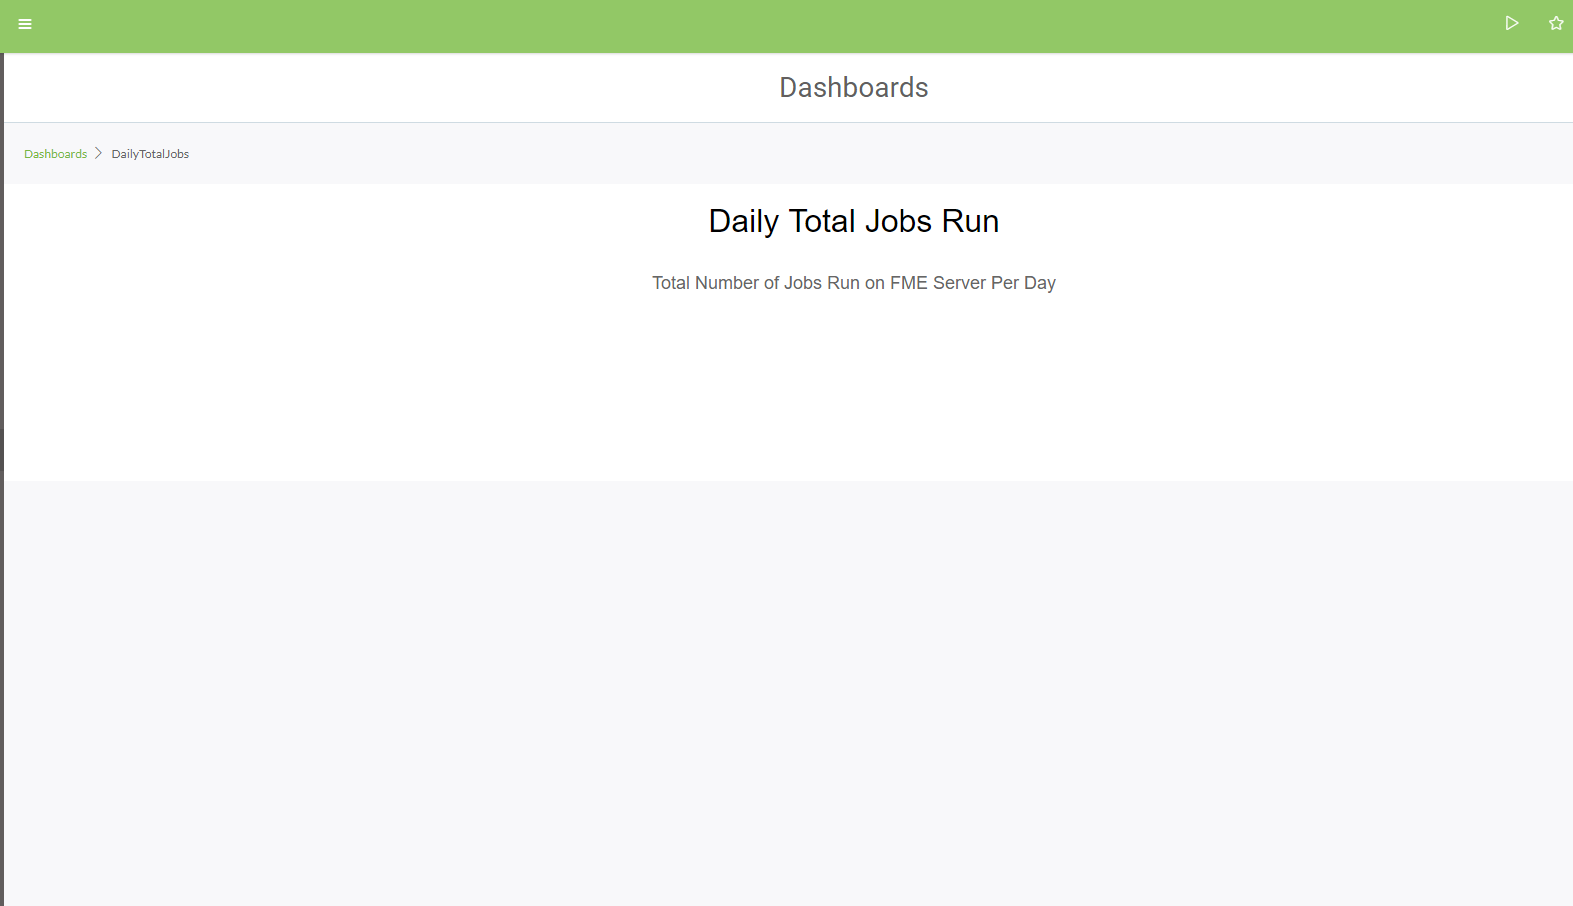
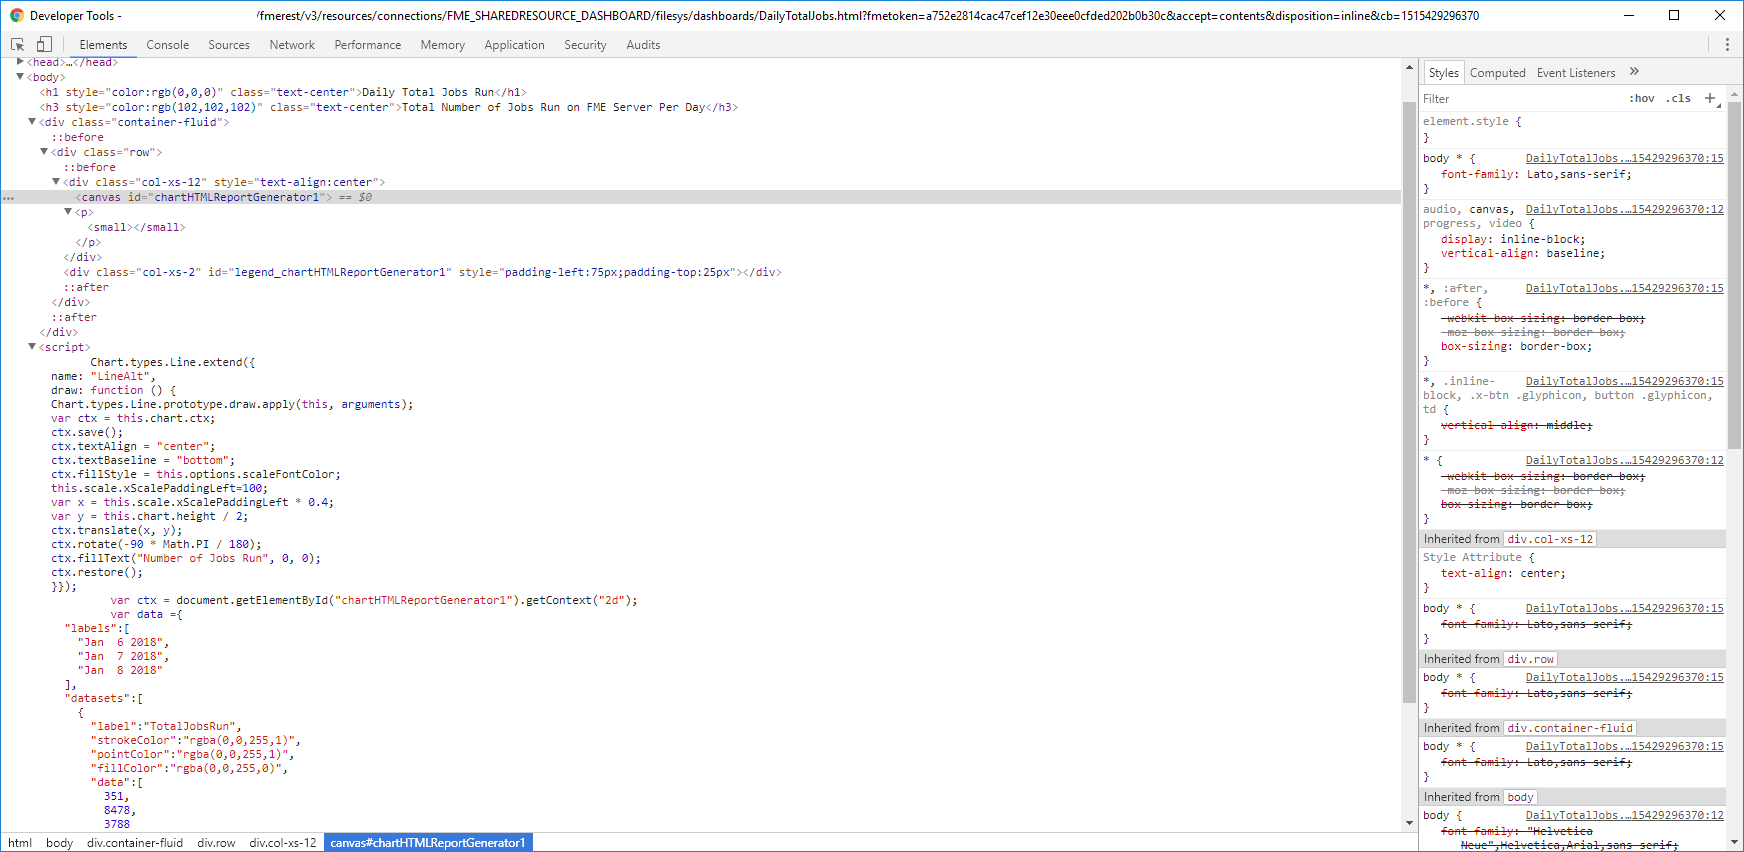
I am able to run the jobs, but the dashboard doesn't return any data inside it. Almost like it isn't reading that CSV log file. I've attached a screenshot of the dashboard and the code of the html dashboard


Also I was able to figure this out just reading in the json natively instead of using the JobHistoryReader.


Hi @runneals

When you say your Dashboards are missing, do you mean the Dashboards page isn't available from the navigation on the left-hand side of your FME Server interface or that there aren't any dashboards listed when you open the page? If the first, perhaps double-check your permissions. If the second, check if the DashboardStatisticsGathering workspace is running correctly on your server (it should be run as a scheduled job that is disabled by default). Or are your Dashboard-related workspaces missing?


The JobHistoryReader inside the statistics gathering workspace hits this REST API endpoint when it pulls down job information: https://docs.safe.com/fme/html/FME_REST/apidoc/v3/#!/transformations/list_get_19 So everything listed in the Response Class there should be accessible. You may have to expose the corresponding attributes inside the JSONFragmenter in that transformer to be able to work with them. The request parameters are for sure available there, but the REST API doesn't return the Request Headers.


@LauraAtSafe any thoughts on why the html isn't correctly created?
@runneals Hmm, no, I don't see anything wrong just from looking at the screenshot there. It looks like there should be data for at least three dates in there. Does the Console tab or Network tab in developer tools there show any errors? I think the next step here would be to take a look at the actual HTML page created by the dashboards. Would you be able to share that file here? If not, could you please send it into support via: https://www.safe.com/support/report-a-problem/ Just let me know if you send it to support and I'll grab the case.


Hi @runneals

When you say your Dashboards are missing, do you mean the Dashboards page isn't available from the navigation on the left-hand side of your FME Server interface or that there aren't any dashboards listed when you open the page? If the first, perhaps double-check your permissions. If the second, check if the DashboardStatisticsGathering workspace is running correctly on your server (it should be run as a scheduled job that is disabled by default). Or are your Dashboard-related workspaces missing?


The JobHistoryReader inside the statistics gathering workspace hits this REST API endpoint when it pulls down job information: https://docs.safe.com/fme/html/FME_REST/apidoc/v3/#!/transformations/list_get_19 So everything listed in the Response Class there should be accessible. You may have to expose the corresponding attributes inside the JSONFragmenter in that transformer to be able to work with them. The request parameters are for sure available there, but the REST API doesn't return the Request Headers.


averagerunningtime.zip


Here's the zipped up html file... @LauraAtSafe


averagerunningtime.zip


Here's the zipped up html file... @LauraAtSafe


Thanks @runneals It looks like the bottom few lines of the HTML are missing for some reason. If you look at the bottom, it ends with some incomplete JSON starting with "var options =" Did any errors or warnings appear in the log file from the AverageRuntime workspace when it ran on your Server? 


I added the following to the end of the file and that made the page work again: 


};
         var MyNewChart = new Chart(ctx).BarAlt(data,options);
      </script>
   </body>
</html> 

Reply