Solved

Can Chart Generator axis values be displayed in scientific notation?

  • March 1, 2023
  • 2 replies
  • 44 views

notmyname
Participant
Forum|alt.badge.img

Hello,

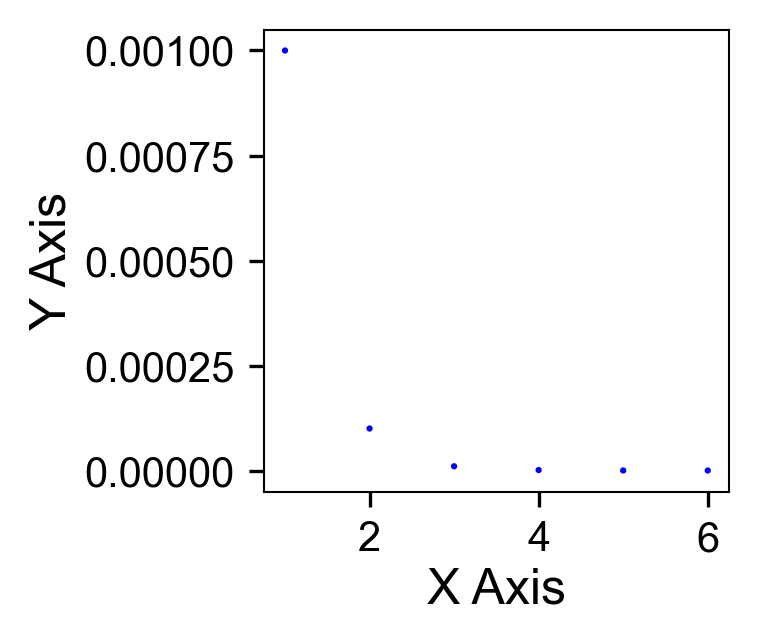
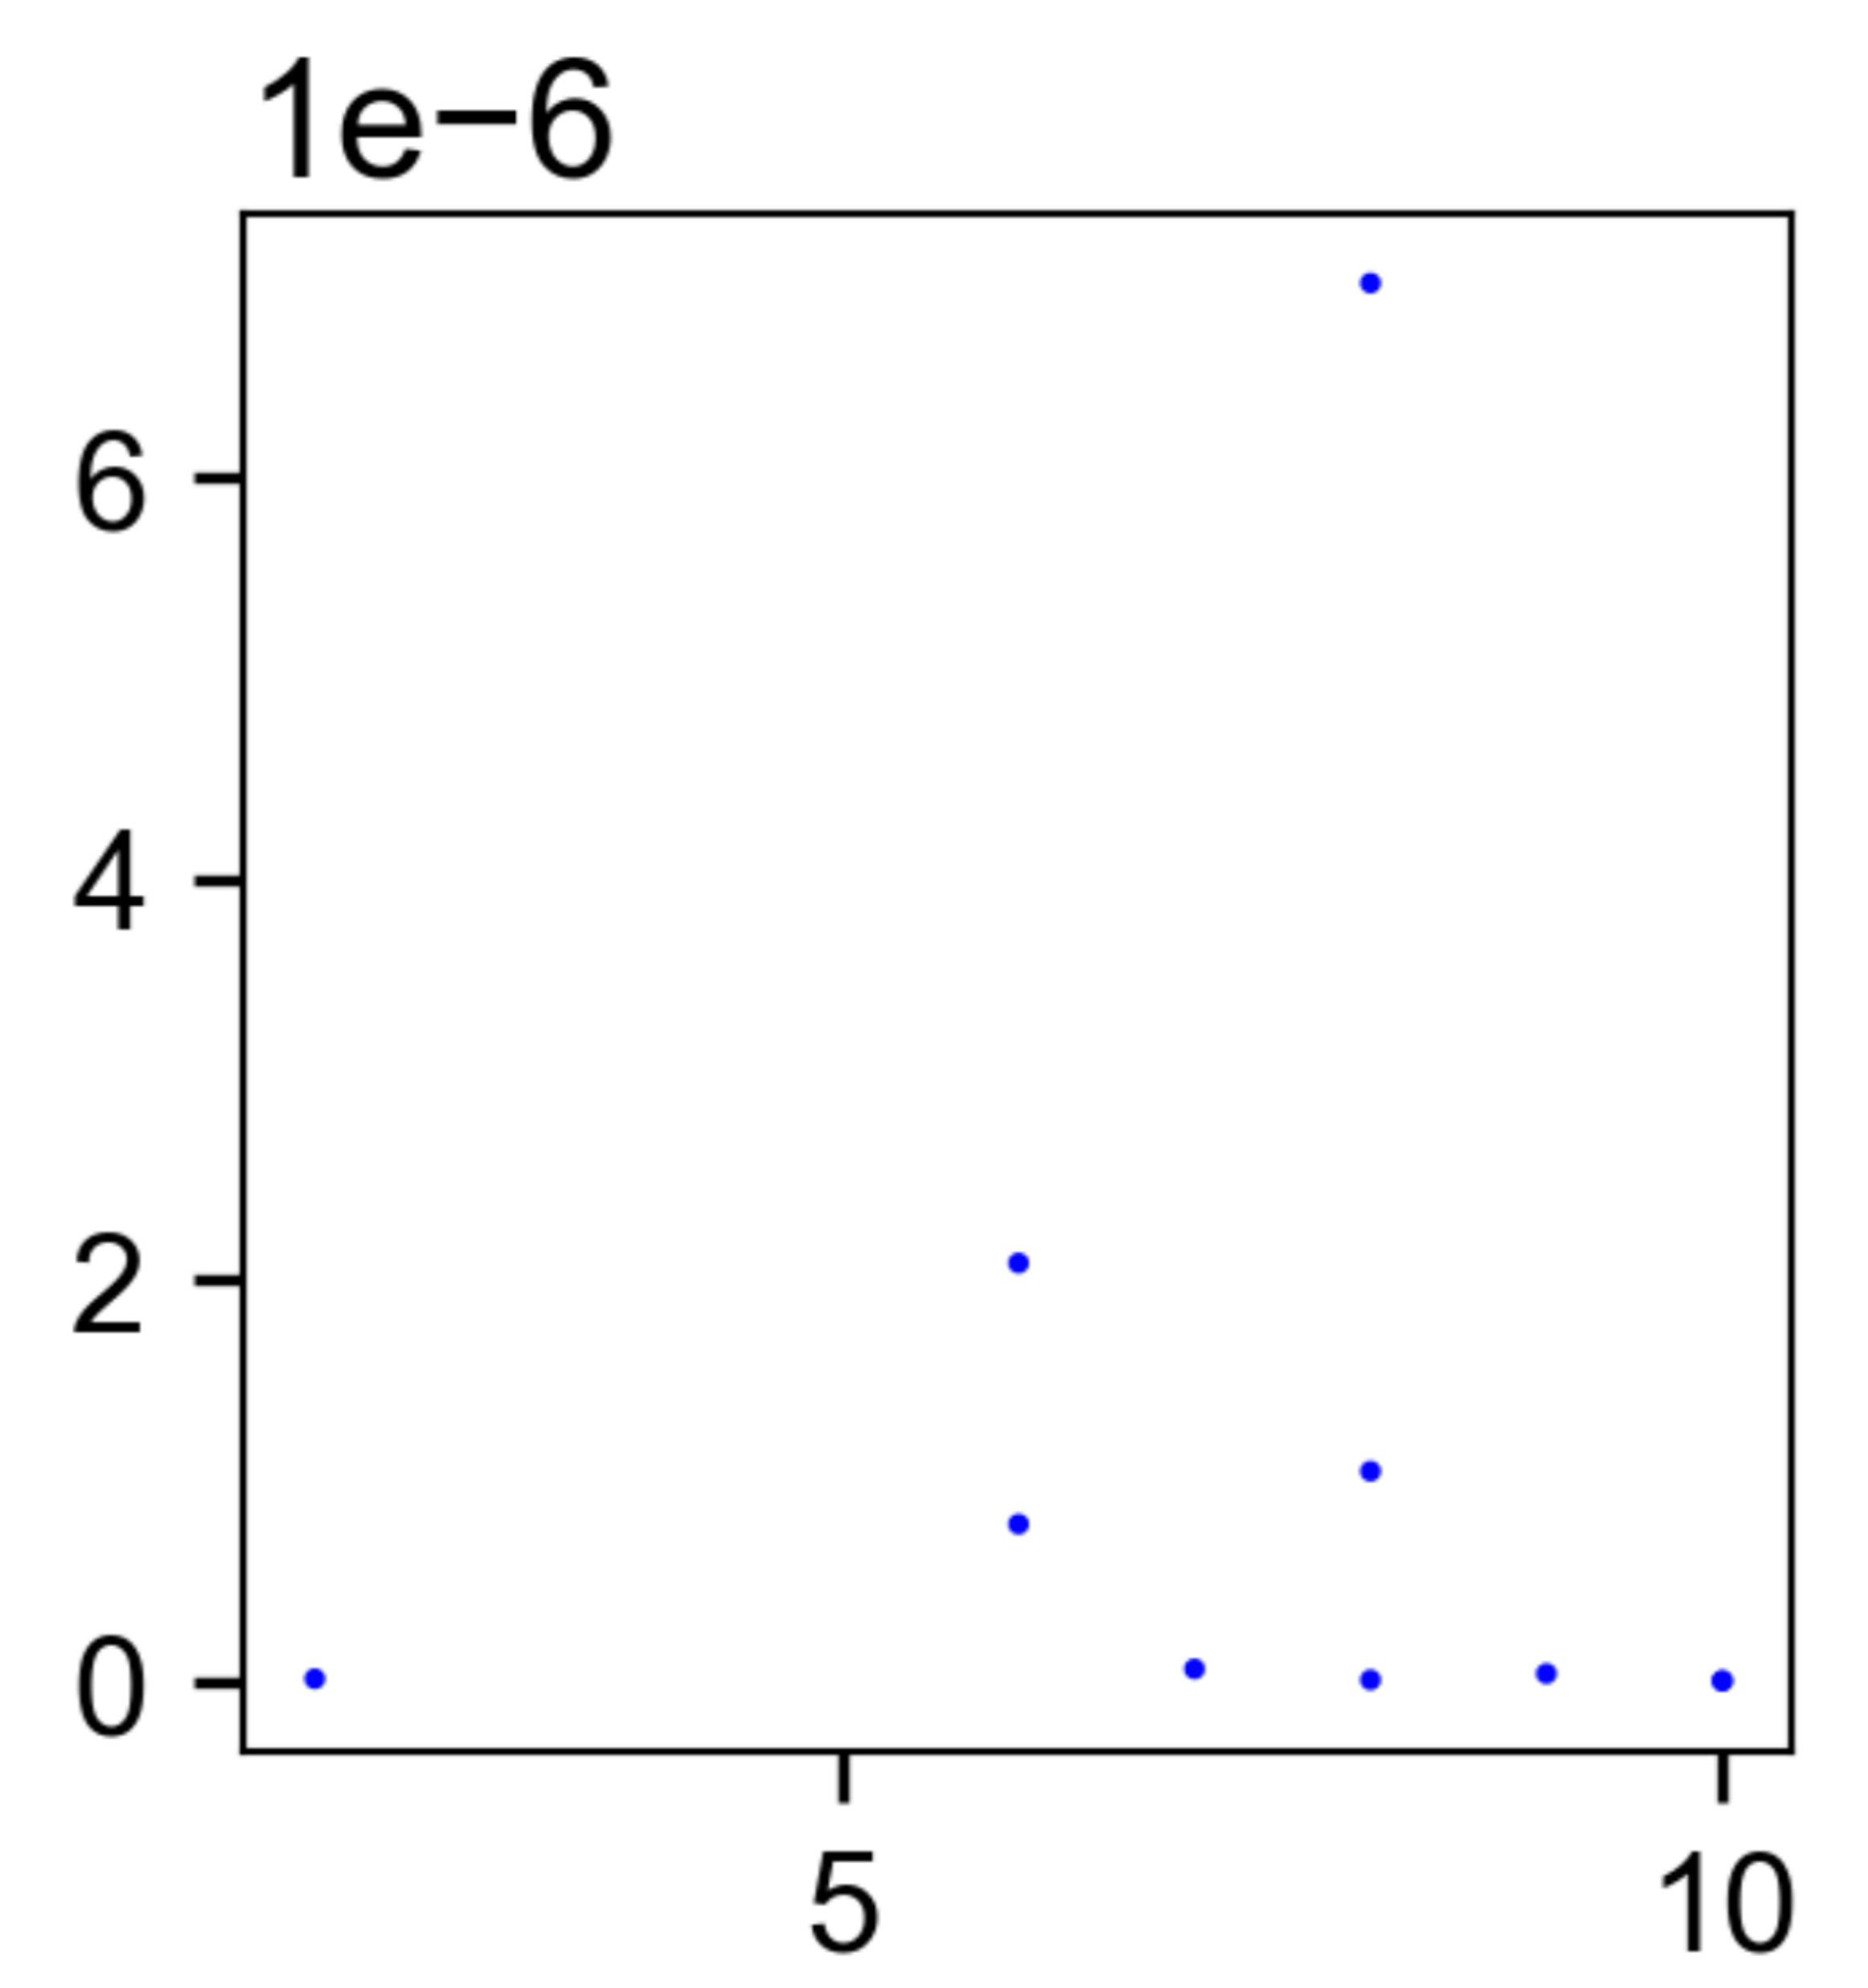
I am using the chart generator with some small numbers to make a scatterplot. I can't figure out how to display the axis values in scientific notation. See the example chart generator output image below using some made up values. The Y axis values range from 1.0e-3 to 1.0e-9. I would like to change the axis values to scientific from decimal.


Thanks for the help


Sheet1 

Best answer by daveatsafe

Hi @David Birkigt​,

You can use the StringFormatter transformer with a Format String of e to convert your numerical values to scientific notation strings before the ChartGenerator. The ChartGenerator will interpret these correctly and create a chart similar to this:

Screen Shot 2023-03-01 at 3.15.22 PM

This post is closed to further activity.
It may be an old question, an answered question, an implemented idea, or a notification-only post.
Please check post dates before relying on any information in a question or answer.
For follow-up or related questions, please post a new question or idea.
If there is a genuine update to be made, please contact us and request that the post is reopened.

2 replies

daveatsafe
Safer
Forum|alt.badge.img+19
  • Safer
  • 1637 replies
  • Best Answer
  • March 1, 2023

Hi @David Birkigt​,

You can use the StringFormatter transformer with a Format String of e to convert your numerical values to scientific notation strings before the ChartGenerator. The ChartGenerator will interpret these correctly and create a chart similar to this:

Screen Shot 2023-03-01 at 3.15.22 PM


notmyname
Participant
Forum|alt.badge.img
  • Author
  • Participant
  • 22 replies
  • March 2, 2023

Hi @David Birkigt​,

You can use the StringFormatter transformer with a Format String of e to convert your numerical values to scientific notation strings before the ChartGenerator. The ChartGenerator will interpret these correctly and create a chart similar to this:

Screen Shot 2023-03-01 at 3.15.22 PM

Appreciate the help. I messed around with e and TCL (not enjoyable) for a bit. I am not quite getting the format I want so I'll probably pursue another charting option.

Thanks