


Happy Friday, and welcome back to Thank Goodness It's FME — your weekly stop for tips, tricks, and the occasional deep dive into the tools that keep your FME workflows humming.
This week, we're tackling something every FME user has faced at one point or another: the slow workspace. Whether it's crawling through a translation that should take seconds, or mysteriously ballooning in runtime when published to FME Flow, sluggish performance can be tricky to diagnose. This week, one of our support specialists, Carl, shares their go-to tool for getting to the bottom of it: FME performance profiling.
One of FME’s lesser-known diagnostic tools gives the ability to generate a precise, per-process timing report for workspaces. This week, we will discuss how to enable performance profiling in FME Form, an undocumented trick for enabling the same profiling in FME Flow, and how to read the output to find the bottleneck in your FME workspace. Let’s dive in!
What is performance profiling?
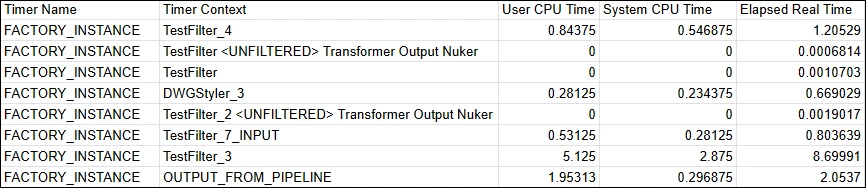
Performance profiling produces a .csv report with runtime statistics - CPU time and elapsed real time - for each underlying process and component of an FME workspace. Instead of scrolling through the job logs and making educated guesses, this gives us a sortable table that tells us exactly which factory ate all that runtime.
Part 1 - Enabling Performance Profiling in FME Form
Beginning in FME 2025.1, this is a built-in workspace parameter that can be found in the Navigator pane.
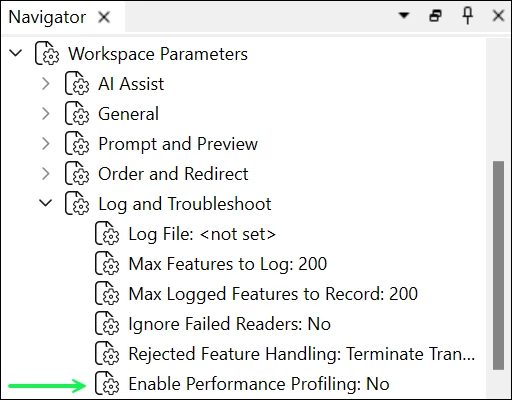
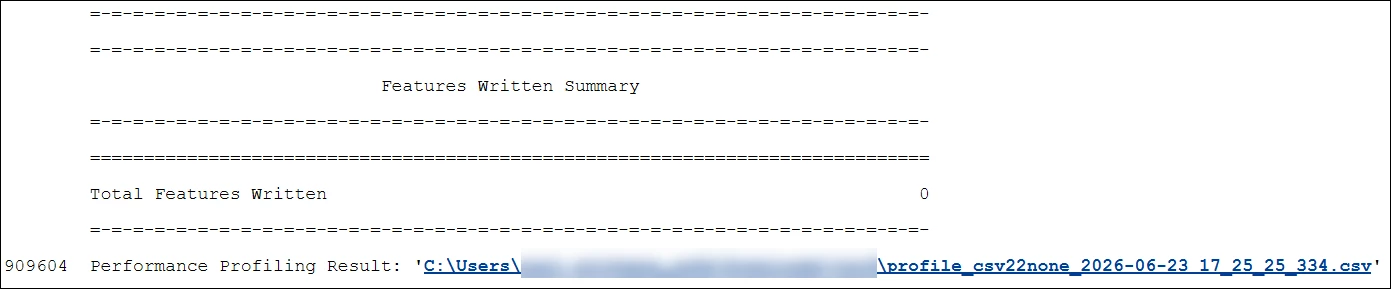
If this parameter is enabled, FME will write the .csv profile to the same directory as the workspace .fmw file. After the workspace completes a successful translation, the file path for the performance profile will be written at the end of the Translation Log.
Still on FME 2025.0 or earlier?
Prior to FME 2025.1, performance profiling in FME Form was enabled by adding a directive to the workspace header:
- In FME Form 2025.0 (or earlier), navigate to Tools > Edit Header to open the Workspace Header editor.
- We will be inserting a row on Line 1:
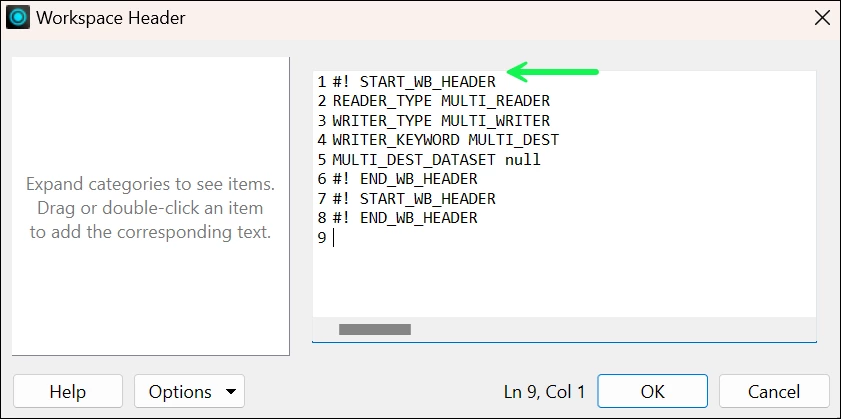
Image: Workspace Header editor (FME 2025.0 and earlier) - On the first line, add the following directive:
FME_PROFILE_RESULT_CSV "C:\TEMP\profile.csv"
The file path and output file name can be adjusted to suit the environment.
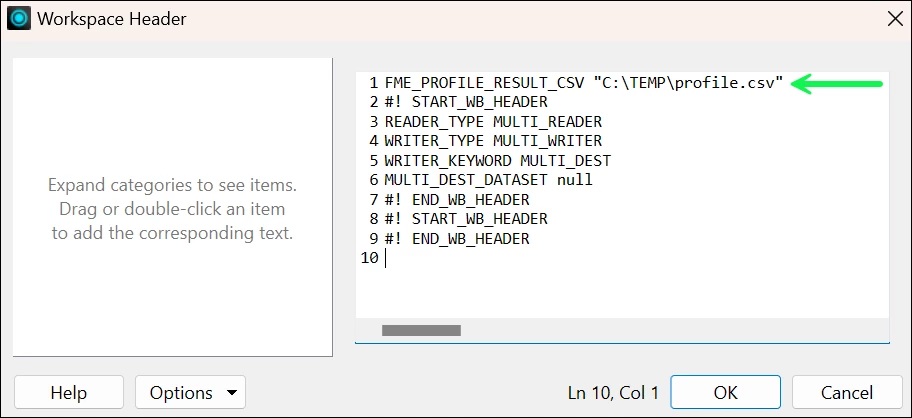
Image: Workspace Header editor (FME 2025.0 and earlier) with FME_PROFILE_RESULT_CSV directive - Click OK, save the workspace, and run a translation. The CSV will be written to the directory specified in the header, but - unlike in FME 2025.1+ - this will not be recorded in the Translation Log.
Part 2: Enabling Performance Profiling in FME Flow
While performance profiling is not officially supported in FME Flow, there is an undocumented trick that allows us to enable this feature. It is in fact the exact same process that we would follow to enable performance profiling in FME 2025.0 and prior, except instead of using the Workspace Header editor in FME Form, this time we will be manually editing the .fmw file in a text editor.
- Open the workspace .fmw file in a text editor and find the header marker by searching for the following string: #! START_HEADER
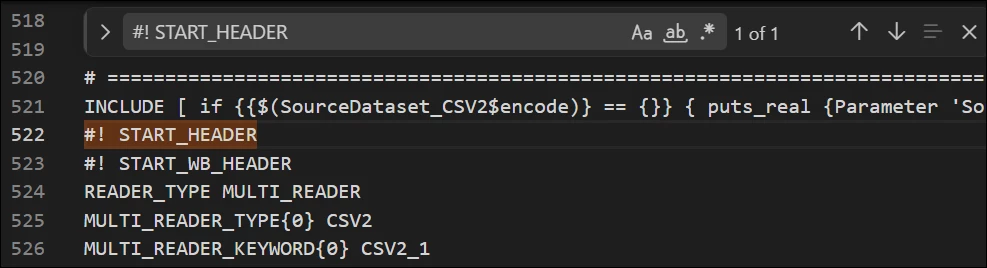
- Immediately below #! START_HEADER, add the following:
FME_PROFILE_RESULT_CSV "$(FME_SHAREDRESOURCE_DATA)/<CSV_DESTINATION_FOLDER>/flow_profile.csv"
Adjust the file path to suit the environment.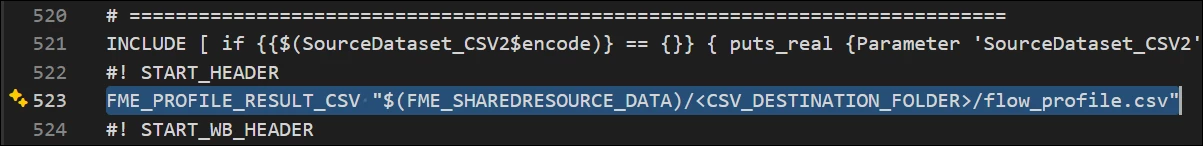
- Save the .fmw, then Publish (or Republish) the workspace to FME Flow.
- Run the job. Upon completion, the Performance Profile will be written to the destination previously specified.
Part 3: Reading the output
Before we start sorting rows to figure out where the workspace is spending its time, it is worth understanding that there are actually two layers in the Timer Name column: FACTORY_INSTANCE and FACTORY_TYPE.
- FACTORY_INSTANCE rows represent each individual process in the workspace. Many of these will be familiar - the factory instances will list recognizable components of the workspace, such as FeatureReader and TestFilter, as well as internal helpers like Output Nuker and splitters.
- FACTORY_TYPE rows aggregate all of the FACTORY_INSTANCE processes by their underlying factory class - QueryFactory, WriterFactory, etc.
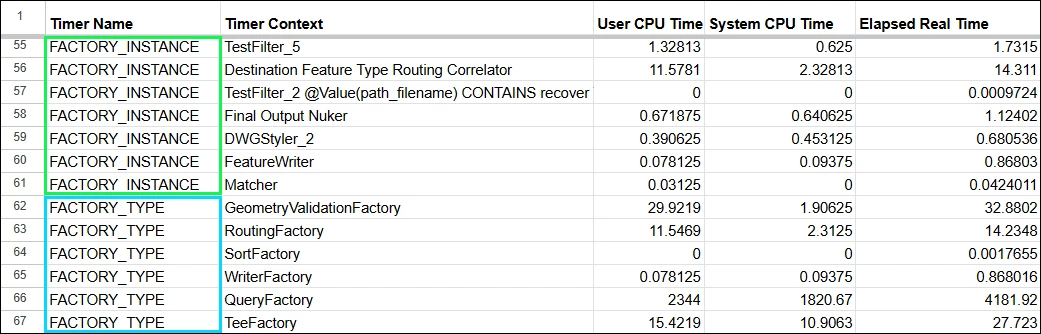
It is often easier to split these two layers into separate tables, especially for large workspaces. The FACTORY_TYPE rows are most useful for quickly understanding what kind of work is consuming the most runtime - geometry validation, queries, writing - while the FACTORY_INSTANCE rows let us see exactly which transformer in the workspace is causing a bottleneck.
Part 4: A few caveats
- Performance profiling adds a slight overhead to runtime, so it is recommended to disable this for normal workspaces running on a production server. This is best treated as a tuning / debugging tool.
- To turn off performance profiling for FME Flow workspaces,we must open the .fmw file in a text editor, remove the FME_PERFORMANCE_PROFILE_CSV directive, save, and then Republish.
- If the performance profiles are being used for A/B testing between Form and Flow, remember to turn off Feature Caching in FME Workbench.
Next week, we're diving into Custom Transformers — stay tuned! In the meantime, have you tried performance profiling in your own workspaces? Drop a comment below and let us know what you found. We'll see you next Friday!