Question

Tabular data - creating table based on count.

  • September 11, 2019
  • 1 reply
  • 21 views

Forum|alt.badge.img+1

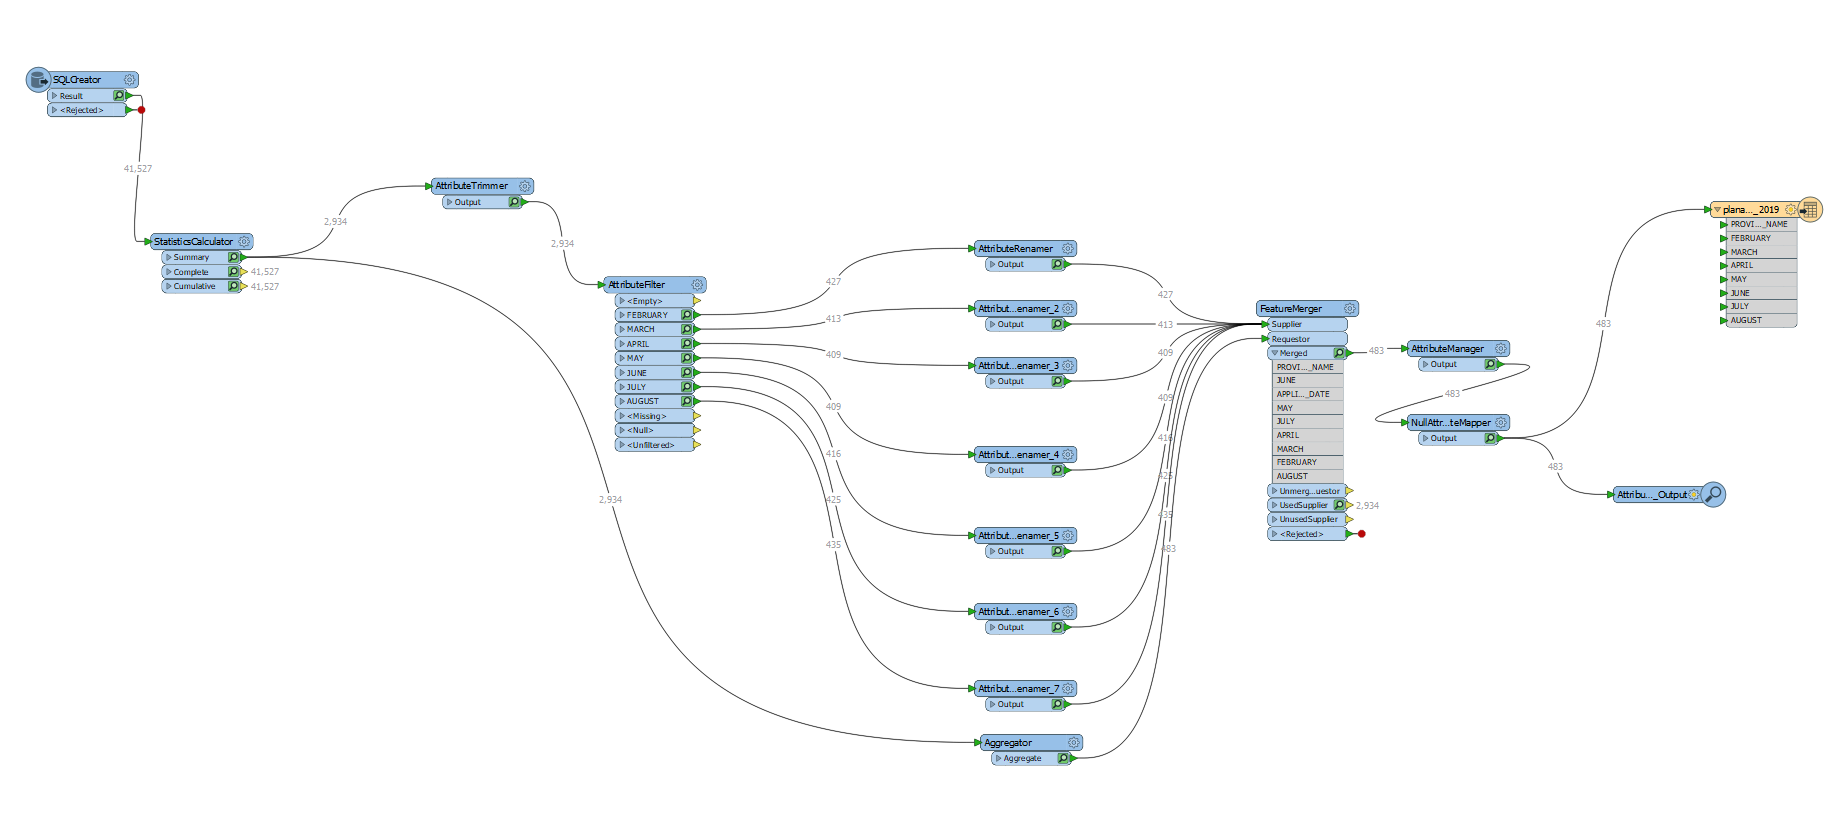
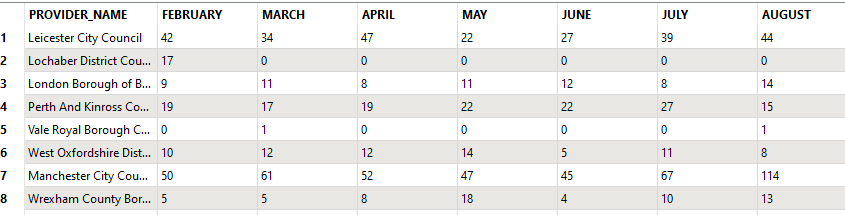
I have a dataset where features contain two attributes - Month and Provider. What I want to do is create a table wherein the Months of Feb to Aug inclusive run along one axis, Provider along the other and the cell contents are a count of occurrences of features per Provider in each month.

I've achieved this using a fairly roundabout method - which was ok given that the range of variables was fairly small; however, I can't help but feel that there is a simpler way, presumably using StatisticsCalculator or AttributePivoter...?


1 reply

ebygomm
Influencer
Forum|alt.badge.img+38
  • Influencer
  • September 11, 2019

This answer might help

https://knowledge.safe.com/questions/47095/aggregate-and-rearrange-tabular-data.html

You can create an attribute which is named after the value (in this case month) then aggregate the data grouping by provider name and merging the attributes. You will need to manually expose the months for them to appear


Cookie policy

We use cookies to enhance and personalize your experience. If you accept you agree to our full cookie policy. Learn more about our cookies.

 
Cookie settings