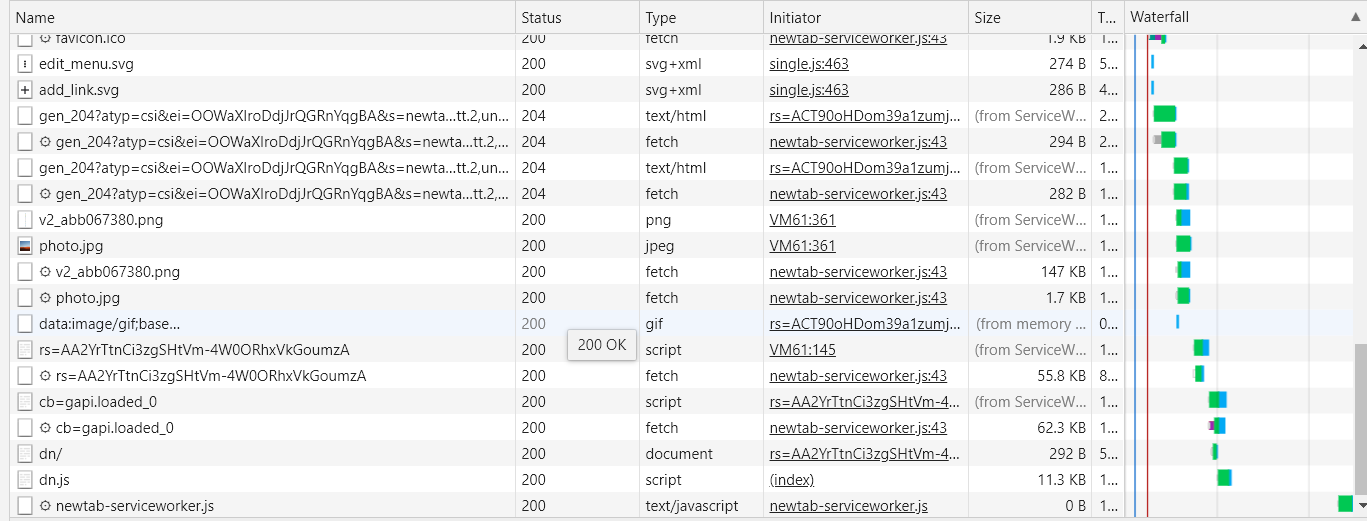



It'd be cool if there was a waterfall view of a running workbench similar to the one in chrome tools so you can see how long each part of the model is taking in a graphical manner, rather than trying to interpret the logs. Each reader/transformer/writer would be a line on the table. If a transformer rejected features it could be highlighted in red. You could also have columns with the number of features that pass through each transformer, its start and end times etc