I am more experienced with R, and using R I would solve it as follows:
# define data frame with test data
df=data.frame(
name1=c("a","a","b","b","b"),
name2=c("a","a","a","b","b"),
value1=c(1,3,6,-9,10),
value2=c(2,3,6,9,1),
value3=c(10,3,3,29,2),
value4=c(-1,34,6,9,6),
value5=c(1,3,6,91,2)
)
# concatenate columns (as i want to group the df by 2 different cols)
df$list=paste0(df$name1,df$name2)
# aggregate df
df.aggregated=aggregate(x=df>,-c(1,2)],by=list(df$list),FUN=max)=,-1]
# re-add data of the two columns that the df was grouped by
comblist=match(df.aggregated$list,df$list)
combsorted=df comblist,]
df.aggregated$name1=combsorted$name1
df.aggregated$name2=combsorted$name2
However, I did not manage to get RCaller work in FME...
Can you confirm, you have some data that looks like thisand you're aiming to get to something like this?
My data is rather like this...
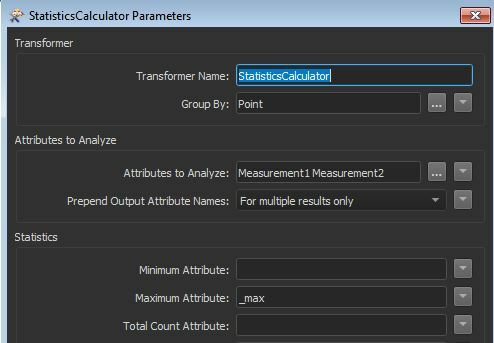
In which case, you should just be able to use a StatisticsCalculator, Group by whatever ID you have for each point, choose the Measurements you want to analyse and get the _max
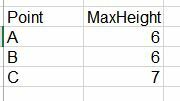
You'd end up with something like this from the Summary port
I am more experienced with R, and using R I would solve it as follows:
# define data frame with test data
df=data.frame(
name1=c("a","a","b","b","b"),
name2=c("a","a","a","b","b"),
value1=c(1,3,6,-9,10),
value2=c(2,3,6,9,1),
value3=c(10,3,3,29,2),
value4=c(-1,34,6,9,6),
value5=c(1,3,6,91,2)
)
# concatenate columns (as i want to group the df by 2 different cols)
df$list=paste0(df$name1,df$name2)
# aggregate df
df.aggregated=aggregate(x=df>,-c(1,2)],by=list(df$list),FUN=max)=,-1]
# re-add data of the two columns that the df was grouped by
comblist=match(df.aggregated$list,df$list)
combsorted=df comblist,]
df.aggregated$name1=combsorted$name1
df.aggregated$name2=combsorted$name2
However, I did not manage to get RCaller work in FME...
By specifying the R interpreter (see http://docs.safe.com/fme/html/FME_Desktop_Documentation/FME_Transformers/Transformers/rcaller.htm) and the installation of many R packages (see https://community.safe.com/s/question/0D54Q000080hcFESAY/rcaller-no-package-called-sqldf) I finally managed to get my R code working.
The code above worked and did exactly what I was looking for. I just had to adjust my input dataframe (instead of my test-df I defined df as my input data from the previous FME Transformer)
df=Passed
and define an output at the end of my code
fmeOutput<-df.aggregated
However, I lost my spatial references on the way and thus had to redefine this, which was no problem...
My data is rather like this...
Perfect! That's exactly what I was looking for. However, is there a possibility to keep the other attributes (those of which I did not calculate any statistics)?
My data is rather like this...
If the values are shared across the features, you can add them to the group by. If they vary across features, you need to decide how you will decide which value to keep. If you look at the data coming from the Complete port, that will contain the min and max as extra attributes against the original data.