Hello.
I have a next situation.
I own a list in Excel with the streets of a certain area of Romania (Bacau County)
I take the example this streets : AGUDULUI, ALBA IULIA and ALECU RUSSO
On AGUDULUI Street I have the even numbers from 2 to 10 on one side of the street and on the other side of the street are the odd numbers from 5 to 13.
Tabel 1.
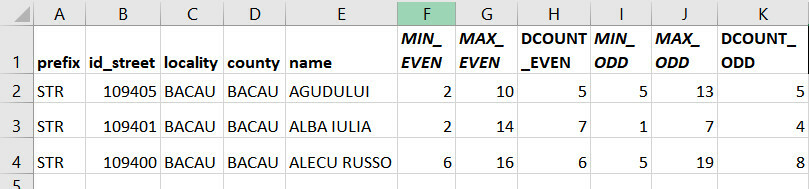
Where:
MIN_EVEN – the lowest even number on the street
MAX_EVEN – the highest even number on the street
DCOUNT_EVEN – the number of even numbers appears on the street
MIN-ODD - the lowest odd number on the street
MAX_ODD – the highest odd number on the street
DCOUN_ODD- the number of odd numbers on the street
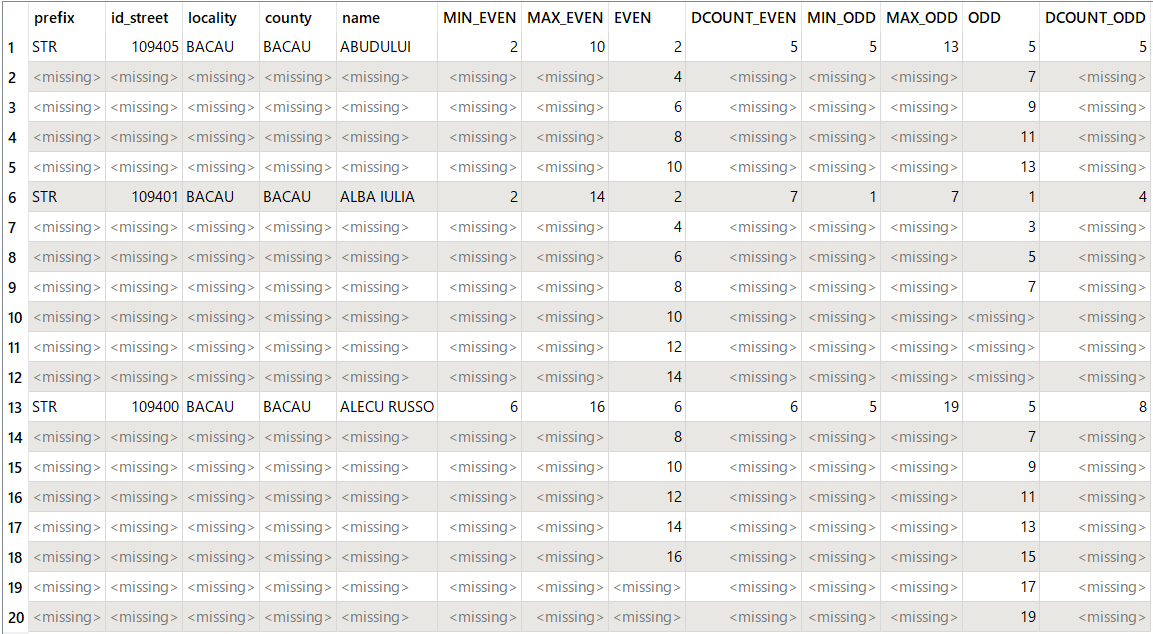
Tabel 2.
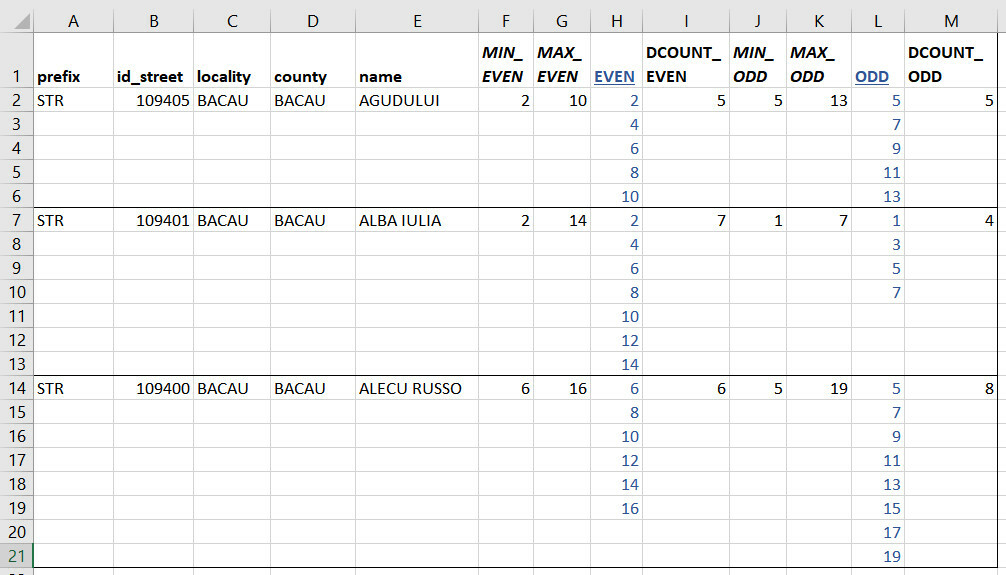
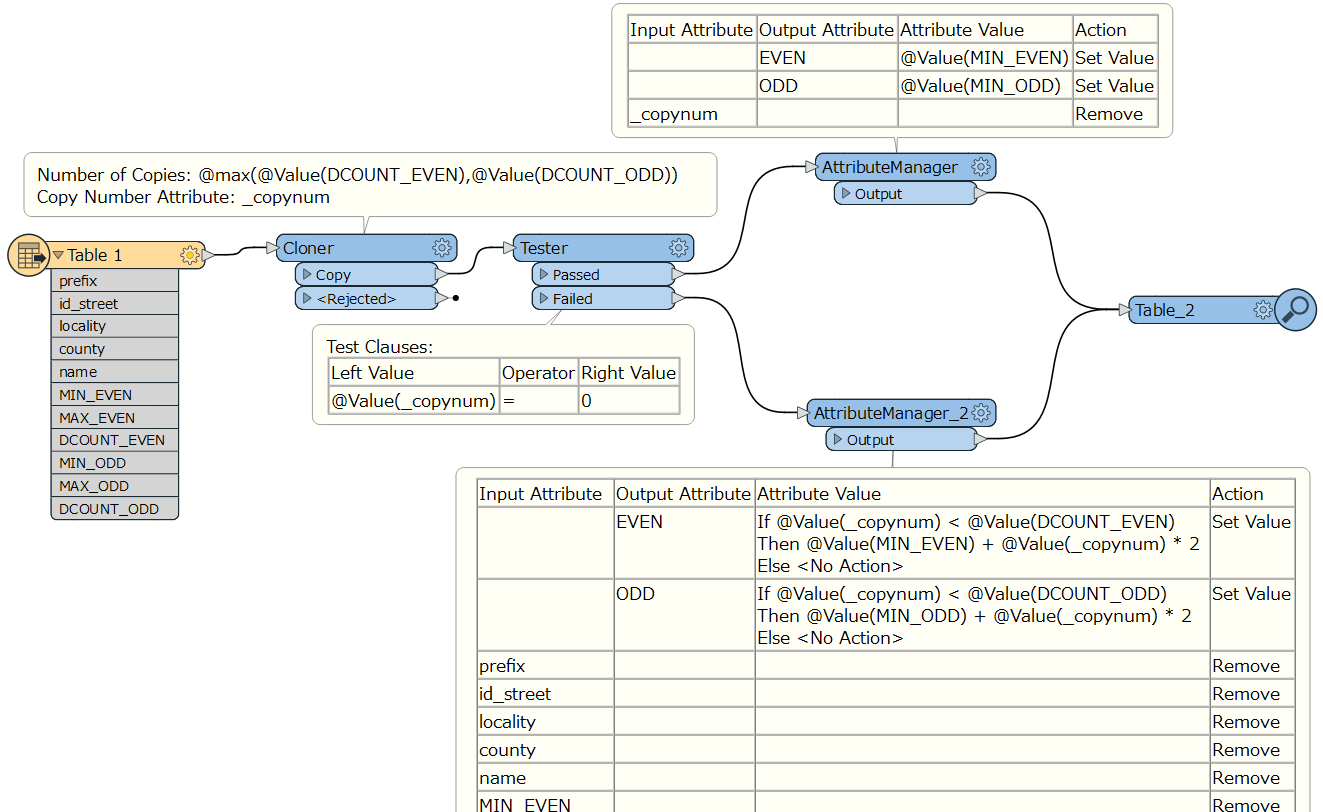
I would like to create some lines and columns (as I put in Table 2 – but may look different) and I wish to populate with the even numbers also with the odd numbers.
Thank you very much.
Sorin Duru