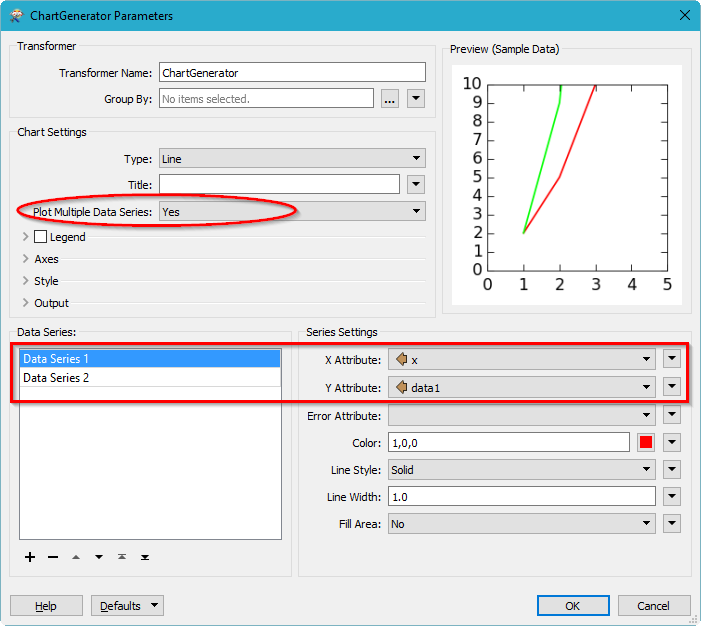
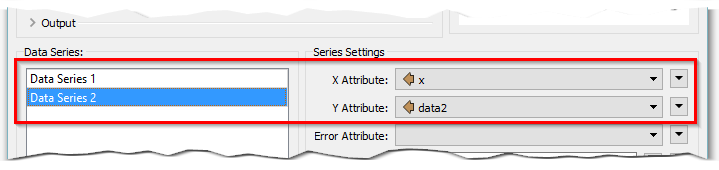
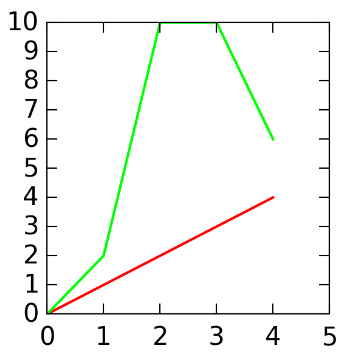
I want to plot 2 data series in one chart. But the chart generator creates 2 charts or make it as one serie. I have used an list with an feature representing the dataserie. And i tried it without the list.

Question
how to use data series in the Chartgenerator
This post is closed to further activity.
It may be an old question, an answered question, an implemented idea, or a notification-only post.
Please check post dates before relying on any information in a question or answer.
For follow-up or related questions, please post a new question or idea.
If there is a genuine update to be made, please contact us and request that the post is reopened.