I am trying to go from this:

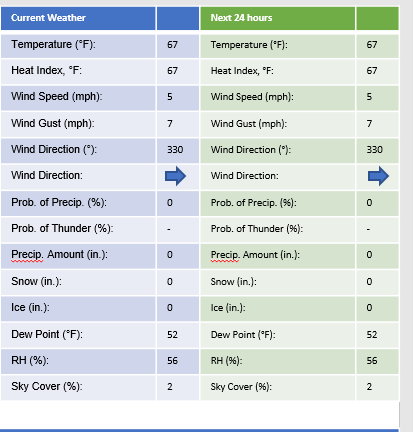
to this:
 Where "Current Weather" is the first "validTime" record and "Next 24 hrs" is the second "validTime" record.
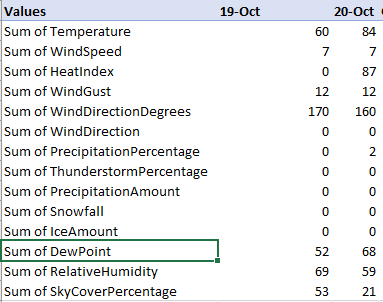
I messed around with the concept in excel and came up with the following which might work but can't seem to replicate it in FME:

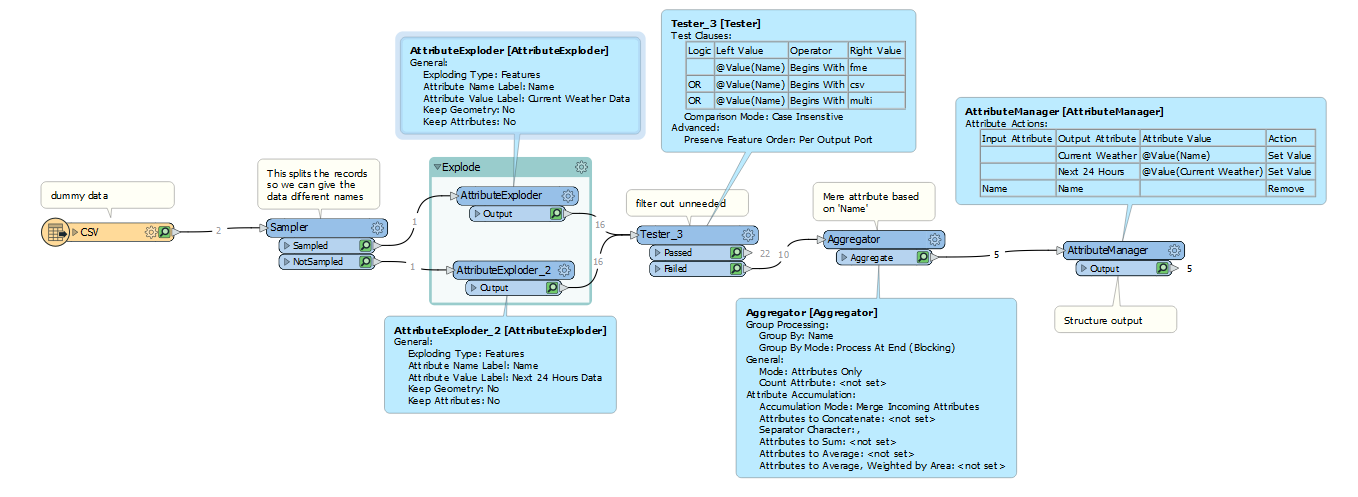
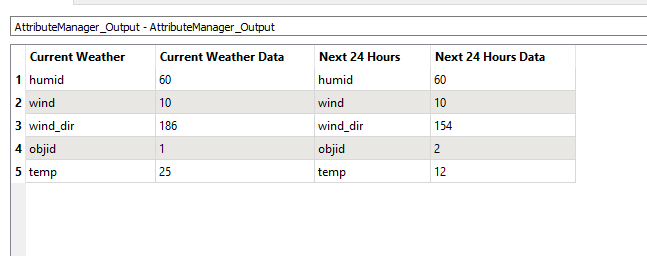
I've played with the AttributePivoter, StatisticsCalculator, AttributeExploder, and others and just can't seem to alter the table to something similar to what is shown above. The idea would be to go from reading in arcgis server service features and write out to an html table (or maybe something else) which would look like (or similar to) the above table.
Any ideas are greatly appreciated!


 The aggregator can then be used to get the data inline


