Question

How do i create a pivot chart using data as headers?


Forum|alt.badge.img

Hello,

I am trying to create what I would call a pivot chart in excel using FME, I have managed to input my data which represents the number of exports from a certain area of a building by date&year; (similar to below - however my table has a lot more rows as it runs to 2030).

DateAreaNumberUnitsExported01/01/2020Area 1501/01/2020Area 2401/01/2020Area 31001/02/2020Area 1201/02/2020Area 2801/02/2020Area 31101/03/2020Area 1101/03/2020Area 2501/03/2020Area 38

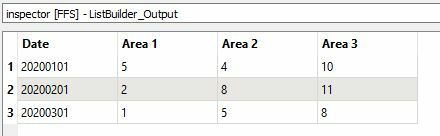
Basically I am trying to get my data to look like this:

-Area 1Area 2Area 301/01/2020541001/02/2020281101/03/2020158

so that I have the date running down the side, the Area Number as the table header and the units exported in the relevant cell corresponding to the correct area and date. I would then like to export this as an excel file

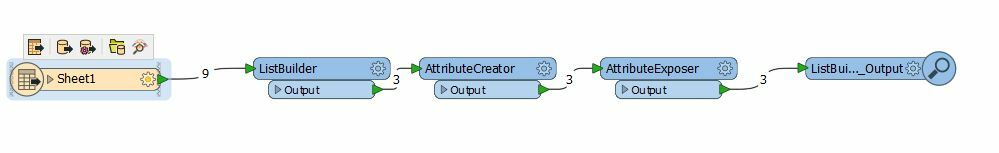
How should I go about achieving this?

Thanks,

Tom

8 replies

ebygomm
Influencer
Forum|alt.badge.img+39
  • Influencer
  • October 24, 2018

Build a list based on date, create new attributes named from the AreaNumber with the value of Units Exported, expose the newly created attributes

excel-pivot.fmwt


Forum|alt.badge.img
  • Author
  • October 25, 2018

That's great, exactly what I wanted! I've noticed now that I have gaps within my original dataset

so as an example looking at the dummy data I sent in its raw format 01/04/2020 may have no records for unit exports from Area1-3 and so does not contain the three rows of data. is there a way of inserting missing rows to my final table?

Thanks


Forum|alt.badge.img
  • Author
  • October 25, 2018
ebygomm wrote:

Build a list based on date, create new attributes named from the AreaNumber with the value of Units Exported, expose the newly created attributes

excel-pivot.fmwt

@egomm That's great, exactly what I wanted! I've noticed now that I have gaps within my original dataset


so as an example looking at the dummy data I sent in its raw format 01/04/2020 may have no records for unit exports from Area1-3 and so does not contain the three rows of data. is there a way of inserting missing rows to my final table?


Thanks


ebygomm
Influencer
Forum|alt.badge.img+39
  • Influencer
  • October 25, 2018
tbarnard93 wrote:
@egomm That's great, exactly what I wanted! I've noticed now that I have gaps within my original dataset


so as an example looking at the dummy data I sent in its raw format 01/04/2020 may have no records for unit exports from Area1-3 and so does not contain the three rows of data. is there a way of inserting missing rows to my final table?


Thanks


Are your dates always the 1st of the month and you want output in 1 month intervals?


ebygomm
Influencer
Forum|alt.badge.img+39
  • Influencer
  • October 25, 2018
tbarnard93 wrote:

That's great, exactly what I wanted! I've noticed now that I have gaps within my original dataset

so as an example looking at the dummy data I sent in its raw format 01/04/2020 may have no records for unit exports from Area1-3 and so does not contain the three rows of data. is there a way of inserting missing rows to my final table?

Thanks

excel-pivot-2.fmwt


One possible way if you want an entry for every month


Forum|alt.badge.img
  • Author
  • October 25, 2018
ebygomm wrote:

Build a list based on date, create new attributes named from the AreaNumber with the value of Units Exported, expose the newly created attributes

excel-pivot.fmwt

I realised I could have explained my problem a little better, so I have posted a separate question on the forum @egomm . Feel free to take a look - thanks.

ebygomm
Influencer
Forum|alt.badge.img+39
  • Influencer
  • October 25, 2018
tbarnard93 wrote:
I realised I could have explained my problem a little better, so I have posted a separate question on the forum @egomm . Feel free to take a look - thanks.
Does the second example I posted not deal with this correctly?


kyrgyzkiwi
Contributor
  • Contributor
  • July 14, 2020
tbarnard93 wrote:

That's great, exactly what I wanted! I've noticed now that I have gaps within my original dataset

so as an example looking at the dummy data I sent in its raw format 01/04/2020 may have no records for unit exports from Area1-3 and so does not contain the three rows of data. is there a way of inserting missing rows to my final table?

Thanks

This is very useful Thank you - I have one related question for folk out there.


I have a very similar situation which I'm dealing with but I don't necessarily know, in advance, how many Area Numbers there will be. has anyone had to solve such a situation?


Cookie policy

We use cookies to enhance and personalize your experience. If you accept you agree to our full cookie policy. Learn more about our cookies.

 
Cookie settings