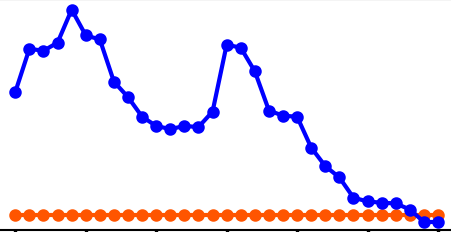
I have a workbench that uses the chartgenerator to create a simple chart graphic that goes into an automated daily email. image below:
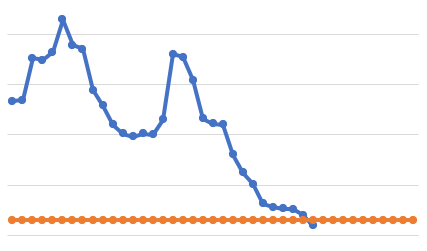
 Blue line is the recent readings and the orange line is a limit (it looks static but it fluctuates throughout the year). I'd like to add a ten-day outlook to the orange line but the chartgenerator can't handle null values on the blue line, it throws the error:
ChartGenerator: Non-numeric input provided. Please validate that the values of the "X Attribute","Y Attribute" and "Error Attribute" (if supplied) are numeric
the htmlreportgenerator can handle the null values but when it's embedded in the email as html content the chart is not in the email, I am assuming it's being scrubbed out by outlook and am left wondering if there is a way to covert the html output to an image which can be embedded in the email.
Desired output:


