Hi Magnnus
The NetworkCostCalculator only works with one source feature per group. So the way to get multiple outputs is to send all of the source points to the NetworkCostCalculator, but with a separate set of network lines for each.
Say you have 5 point features. Add a Counter to the point features to number them 0,1,2,3,4. Then add a Cloner to the line network. Create 5 clones. Set the Copy Number Attribute to be the same attribute name as the Counter created.
Then you can pass them into the NetworkCostCalculator and set Group By to be that attribute. It's inefficient because you are creating multiple copies of the network, but it's the only way I see to do it.
So, that will create you multiple sets of results.
However, I'm guessing that you want to see the effect of having X starting points on the same network. I don't see a way to do that with just the NetworkCostCalculator. I think you will have to create multiple results (as described above) and then post-process them.
For example, use a Chopper transformer on the NetworkCostCalculator output to create points (set Max Vertices = 1). The Z value of each point will be the distance. So look for matching points and keep the ones with the lowest Z value. To do that I'd use the CoordinateExtractor to get x,y,z; a Sorter to sort in Z value order (low to high); then a DuplicateFilter to filter out duplicate x,y values.
Then you have the results as if there were one network with multiple sources, and can send it to the SurfaceModeller as required.
For example, here's what I get when I use the City of Vancouver roads/firehalls:
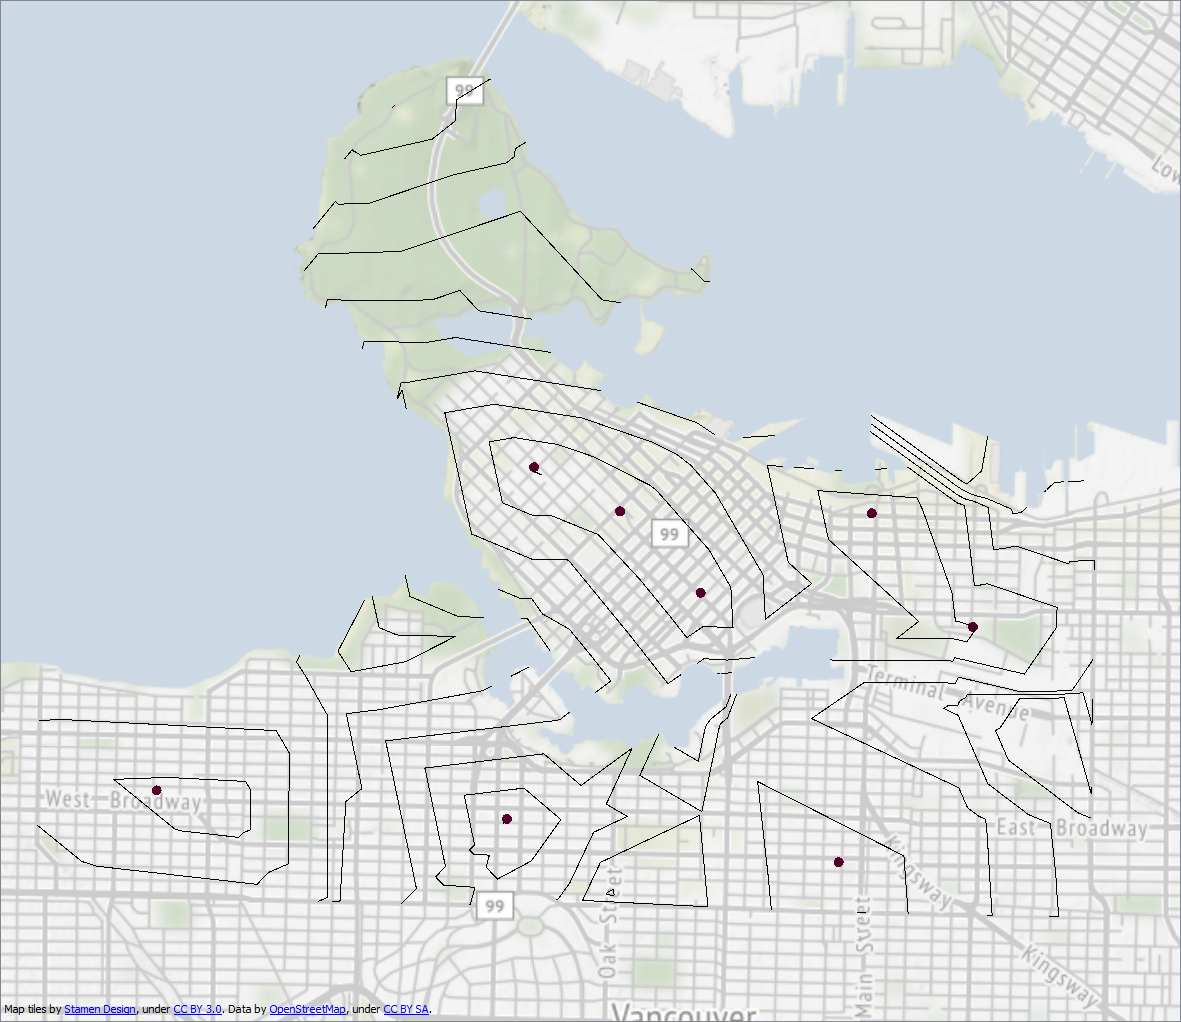
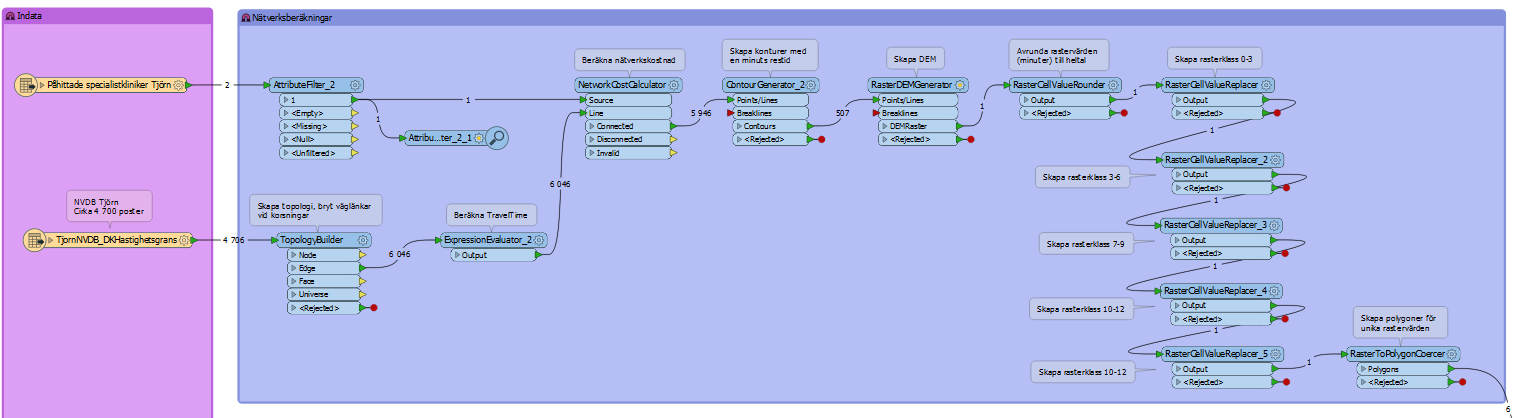
Here's the workspace thatcreated this. I hope it's what you are looking for.