Hello,

I want to know what features from the little red diamonds feature class don't match the big red triangle's number (seen in FME1 screenshot).


FME2 screenshot shows the null attribute values for the little red diamonds that should read T-9623 from the big red triangle.


These features participate in a geometric network connected by line segments.


I'm trying to do QA/QC to clean up the data but first need to filter out the incorrect values.


@cshir065​ Try NetworkTopologyCalculator on all the conductors. This will give you a unique network id for all the connected lines. (you can use Aggregator with Group By network id to visualize the connectivity) .Then you can use SpatialRelator to match the points to a network. Of course, everything on your existing has to be correctly noded (snapped) and also split any complex edges.

Example attached (FME 2022.2)


@Mark Stoakes​  Thank you for the response and the example. I know all my data is snapped together but I'm unsure what you mean by complex edges.


The lines that are snapped together are not receiving the same _network_id from the Network Topology Calculator.


Thank you for your help 😉


I'm going to venture a guess, is this some kind of utility network? Maybe electric? I'm going to refer to them as Primary Line -> Transformer -> Secondary Line -> House.


If you're using the network topology calculator, check what you're using for grouping. Perhaps the secondary lines are getting considered separately.


Complex-edge means objects are allowed to snap to the EDGE of a line and still be in connectivity. Most networks I see are simple-edge where lines have to be split at every junction.


FME can't talk to a geometric network of course. But you can push data downstream intelligently. Use a spatial relator to link the red boxes to the blue lines. Then another spatial relator to link blue lines to red diamonds. You'd have to think about edge cases like what if there are two or more blue lines in between your points. Depending on your environment, SQL intersect queries or arcpy scripts are other options.

@mlauer​ Thank you for the response. I did try grouping them and got a couple more connections but it's still not working fully. Please see attached screenshot.


@cshir065​ As @mlauer​ suggests, you need to split complex edges at all junctions for FME to recognize the topology. There shouldn't be any grouping in the NetworkTopologyCalculator.

In my example, you can see that I'm splitting the complex edges where the laterals connect.


@mlauer​ Thank you for the response. I did try grouping them and got a couple more connections but it's still not working fully. Please see attached screenshot.

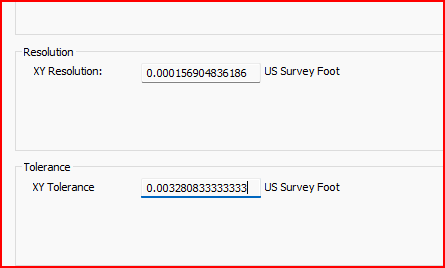
I have some experience trying to trace a geometric network, and I might know what you're running into. First it might help if you extracted the XY's of the span endpoints. Using SQL might be easier if you're in that environment (feature.shape.STStartPoint().STX, etc). Look at them closely. Are they exactly the same or almost the same? ESRI has a microscopic tolerance here. Features can be just the slightest bit off and still work in the geometric network. But other tools like FME can see the difference. I think that's what you're running into.


We've tried solving this a few different ways - the most basic solution is rebuilding the geometric network, using the buffer option when it comes up. It helps make features exactly coincident in these cases.


image


@mlauer​ Thank you for the response. I did try grouping them and got a couple more connections but it's still not working fully. Please see attached screenshot.

@mlauer​ 

This is exactly what the problem is! Thank you for the insight. Unfortunately, I'm not able to rebuild the geometric network.


@mlauer​ Thank you for the response. I did try grouping them and got a couple more connections but it's still not working fully. Please see attached screenshot.

Good to hear! That explains why the network topology calculator calls them separate. Now you have to decide if it's a problem you need to address, or if you can work around it. We've made tools that mimic tracing a geometric network, and this is one of the main problems we had to solve. In our case, rebuilding the network is the solution. You could try using FME to make lines coincident, but it's hard to replicate how the geonet automatically drags features together. Some point features might be free-floating afterwards.


Your goal is to find the upstream junction from the viewpoint of each house. I think you can build this in FME, but the catch is do you need to iterate? I handle utility networks where there can be one, two, three or more segments of line between the house and the upstream junction. That means you need to use loops and iterate through features, which makes me lean towards python. I've done loops in FME and it's so much easier to write straight code.


@mlauer​ Thank you for the response. I did try grouping them and got a couple more connections but it's still not working fully. Please see attached screenshot.

I thought about this a little more this morning. What format is your data in? We work exclusively in SQL. If I was attempting to compare house/junction attribute like you, this is how I'd solve it:


1) Your Junctions (red squares) presumably have a unique identifier. If you can't trust that, fall back on the ESRI ObjectID.

2) Add a JunctionID field to Secondary Lines and Consumers.

3) Use SQL to run a spatial join between Junctions and Secondary Lines. Push the identifier into the SecondaryLine.JunctionID field.

4) If you have multiple Secondary Lines in sequence, you need to keep pushing the identifier to those downstream ones. Use CTEs to separate Secondary Lines into two groups, one with null JunctionIDs and one with non-null JunctionIDs. Do a spatial join between these two groups, and update the null JunctionIDs.

5) Repeat the above query as needed. If you have up to five secondaries in sequence, you need to repeat the query four times.

6) Now do a spatial join between Secondary Lines and Consumers. Take the JunctionID from the secondary and populate the consumer.

7) Now you have a data tie between Consumers and their upstream Junction. You can join records with that tie and do your analysis, like finding where identifiers don't match. Or pushing values from one side to the other.


I don't think FME is the best tool for this, though technically if you built this workflow and verify it works, there are several ways to make FME run SQL.


Reply