Question

ChartGenerator: line chart and date interval labels on x axis difficulties


At the moment I am having difficulties with finalizing the layout of a line chart.

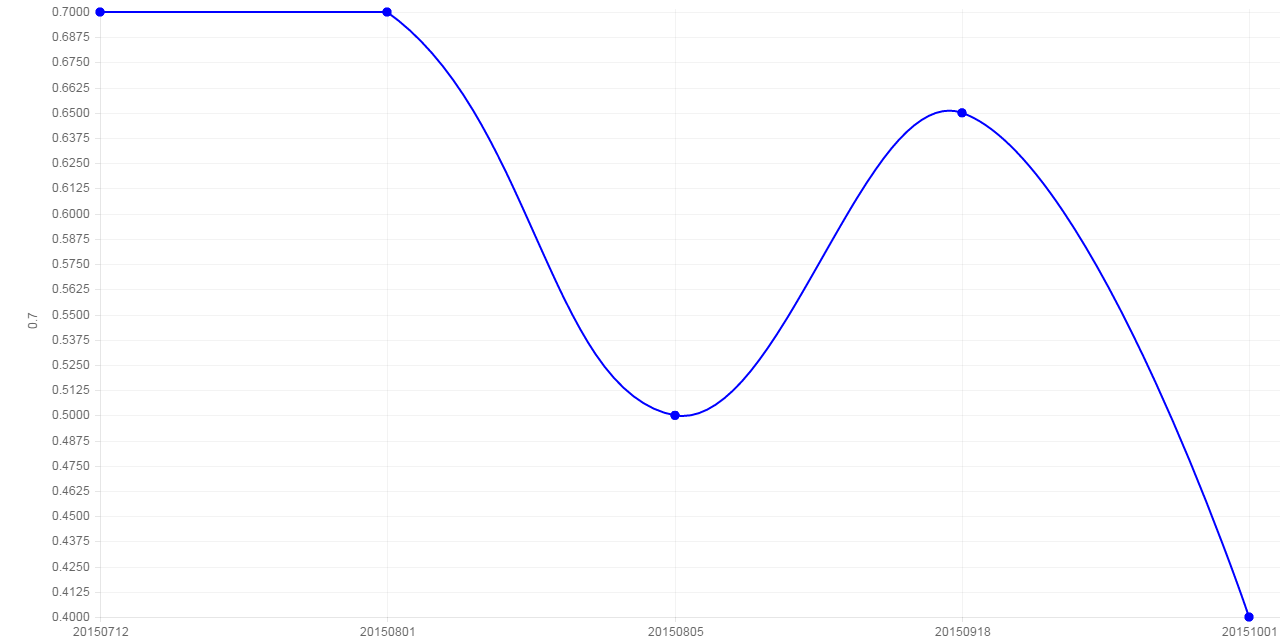
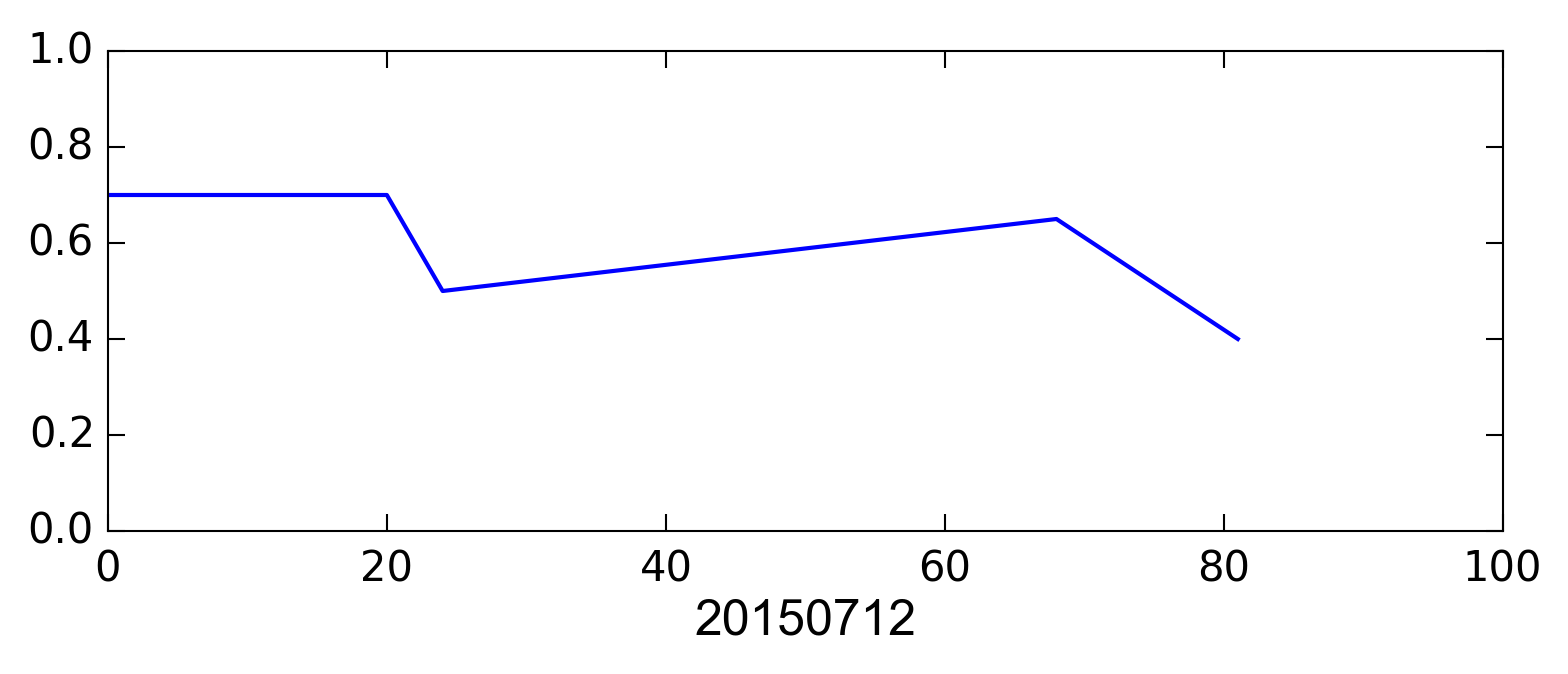
This line chart is showing the graph of the NDVI vegetation index for a parcel through a season.

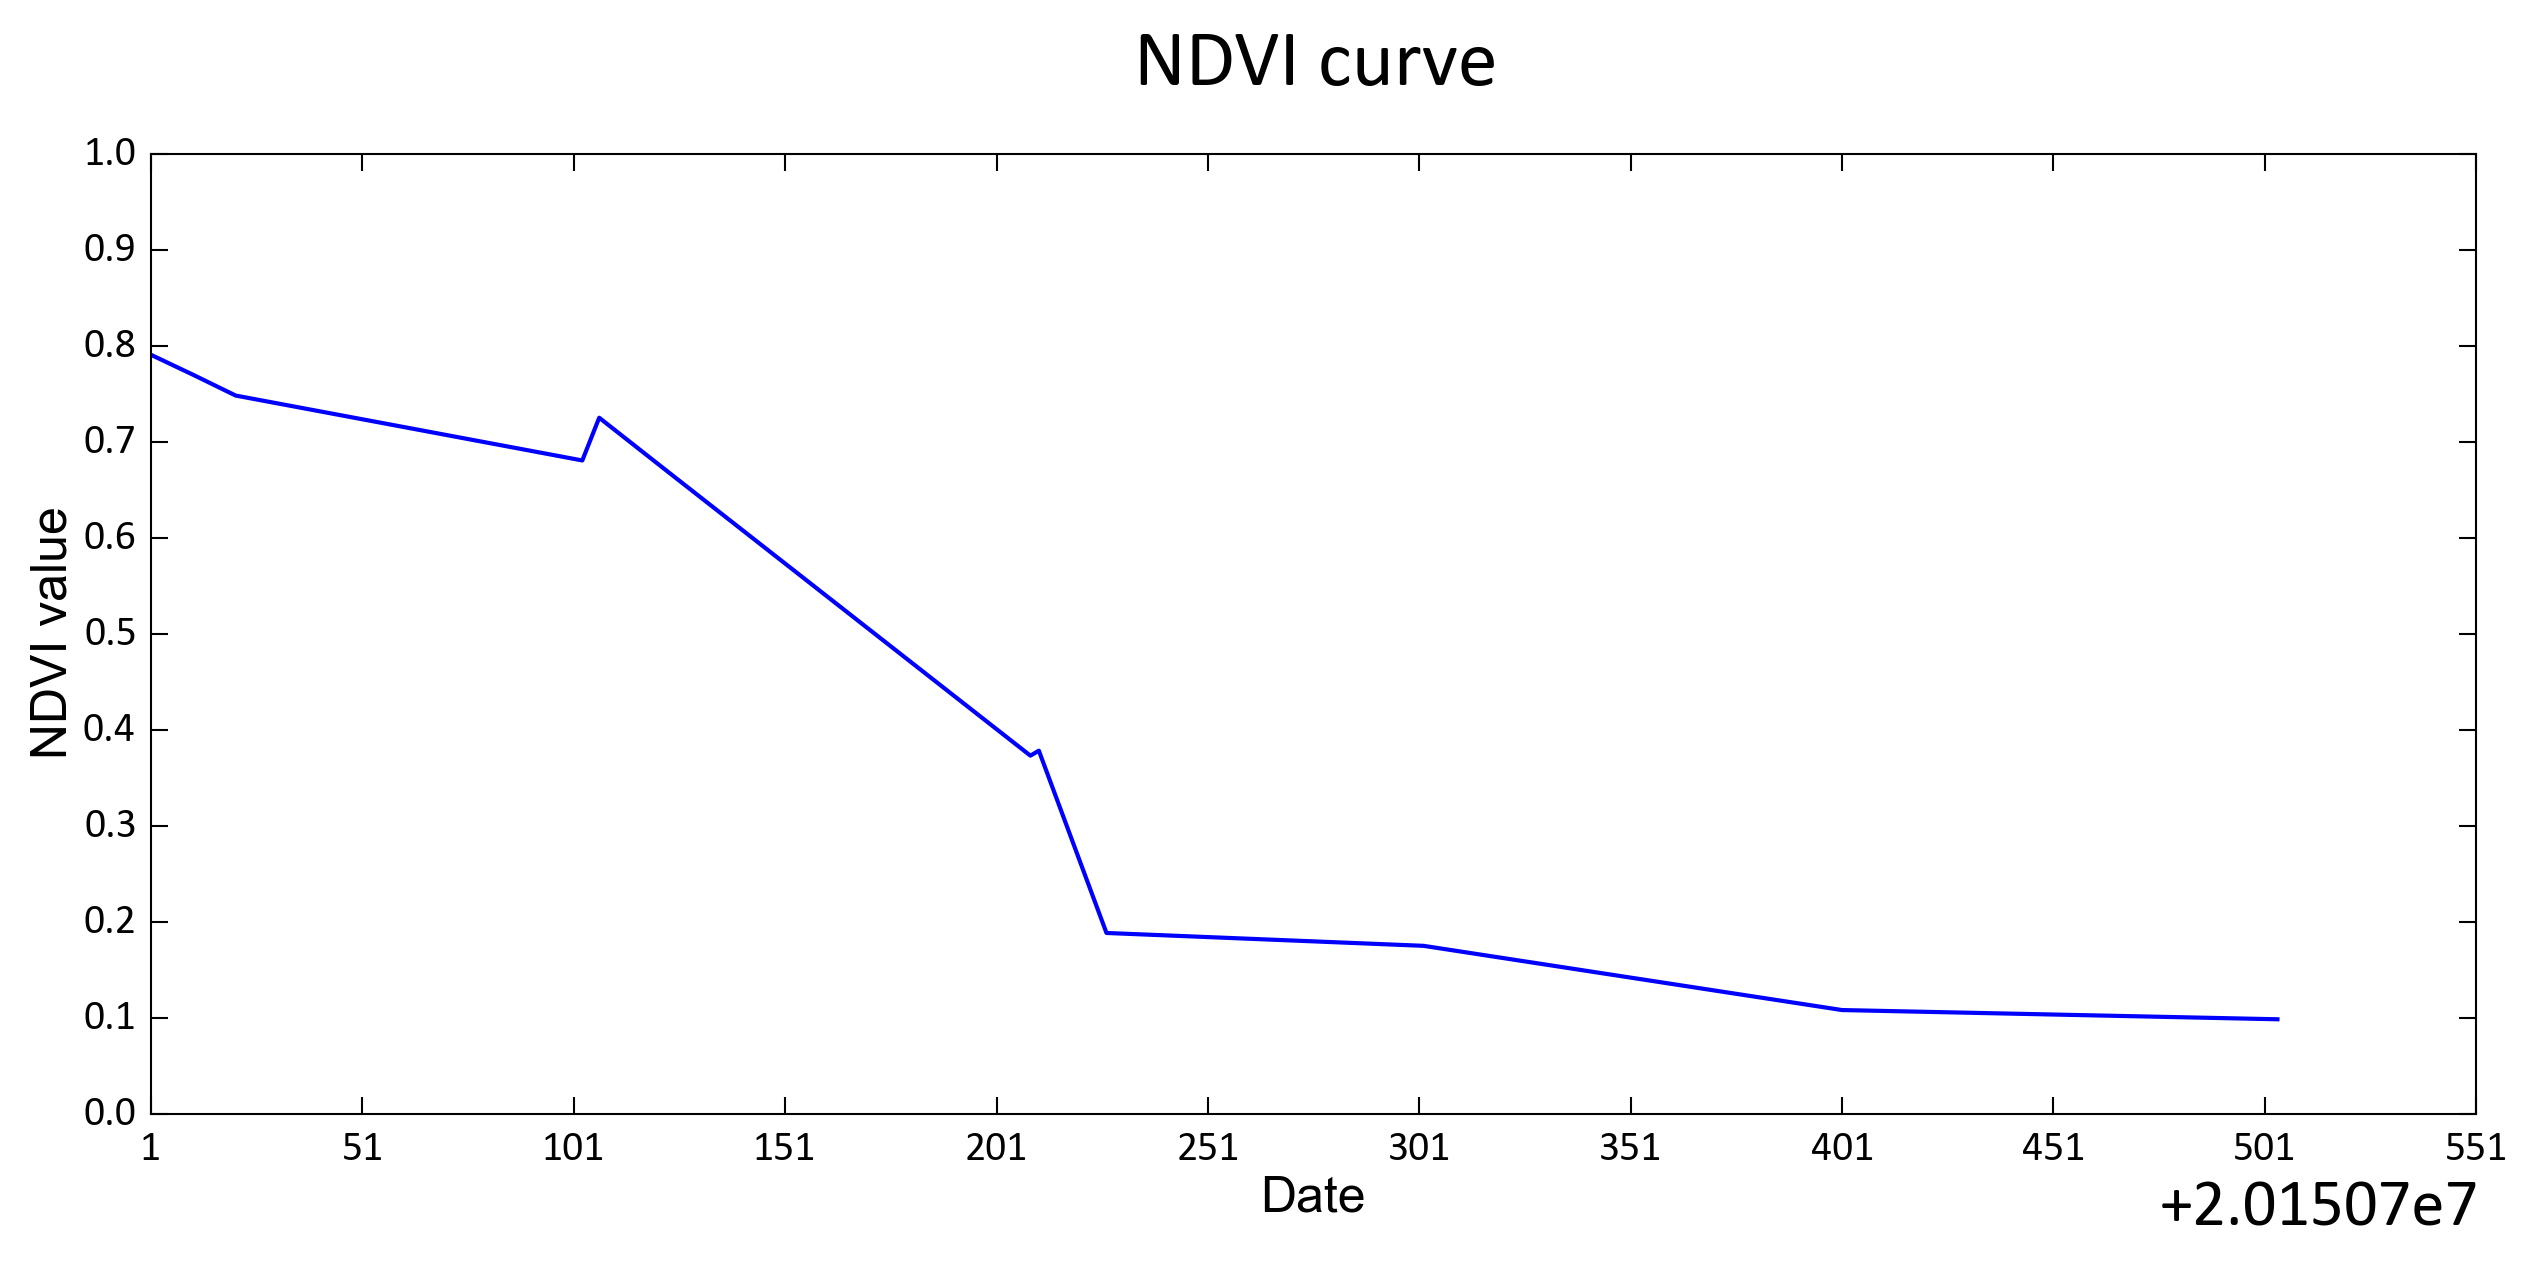
I would like to have the dates being represented on the X axis. But as you see on the enclosed image, FME makes the date (written as for example 20150701 = yyyymmdd) visible as an exponential number. This makes it difficult to understand.

I also tried to use another date notation, for example yyyy-mm-dd, but with non-numeric characters I only get errors (which I can imagine).

How can I get rid of the exponential notation?


How can this transformer understand date notation?


And is it possible to make use of the 'date' attribute in the source data (also used for the x axis values) for creating the labels on the x axis interval?

I have searched a lot, but there is a very low amount of documentation for making line charts using this transformer at all...

Greetings and thanks in advance,

Martin

4 replies

mark2atsafe
Safer
Forum|alt.badge.img+43
  • Safer
  • August 31, 2016

Hi @martinl

I think this is a bug and have filed it with our developers to see what they say. The reference number is PR#71995. Hopefully they will be able to make a fix and suggest a workaround.

In the meantime, the only solution I can see is to drop the year by removing the first four digits. If the number is a maximum of 4 digits, then the result will be OK. But of course that will be a problem if you have more than one year of data.

Apologies for the inconvenience this must be causing. I hope to hear back from our developer soon.

Mark


jdh
Contributor
Forum|alt.badge.img+28
  • Contributor
  • August 31, 2016

The HTMLReportGenerator can interpret Date values correctly, but doesn't give you a lot of options.


Alternatively use the ChartGenerator with the x value being the difference in days from the first measurement,


itay
Supporter
Forum|alt.badge.img+17
  • Supporter
  • August 31, 2016

Hi @martinl

Just a thought... formatting the attribute (StringFormater) into a string data type makes any difference?


  • Author
  • September 2, 2016

836916.pngThanks for the reactions, I am testing all your options.

@Mark2AtSafe:

Thanks for sending the case to the developers, I am curious what comes out. I tried to convert the dates to mmdd format (or mdd for the month numbers with 1 digit). But this makes FME unstable/slow somehow (takes all my 8 GB RAM for this small graph workbench), and the preview of the graph given in the transformer isn't visible as well, just keeps on loading... Sometimes FME crashes when running (version 20150715 build 15515) and my computer becomes terribly slow even minutes after running as long as the workbench is opened, but it is possible to get output.

Also, using dates makes it always difficult to interpret the graph correctly. A month has 31 days at maximum, but on the x axis, the range will count to 100 days a month then. This gives a bit weird visualisation of the graph at all.

@jdh

I don't have the transformer HTMLReportGenerator available. But otherwise it was maybe a decent solution. I will test it also using day numbers.

@itay

Using data format string doesn't change anything in the result, unfortunately.

I included the graph how it is now...


Cookie policy

We use cookies to enhance and personalize your experience. If you accept you agree to our full cookie policy. Learn more about our cookies.

 
Cookie settings