Just wondering if anyone has tried the (very) new DICOM reader in 2018.1 Desktop.
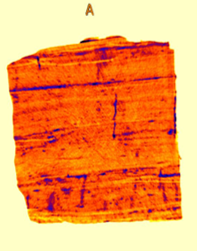
I would like to process several folders of NON-MEDICAL DICOM CT images in an engineering application, using the raster (relative density) data returned in x,y by z slices to create a fully dimensioned 3D model suitable for viewing in a standard browser.
Being able to project the DICOM x,y,z coordinate system into a real world coordinate system would be a distinct advantage, as would being able to contrast and window to observe specific features.
Any experience people have with this greatfully appreciated.
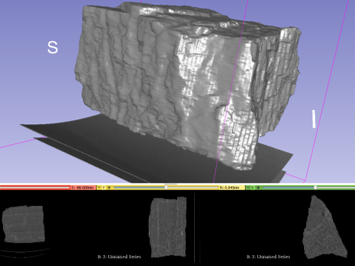
I've had a little success in creating at least point cloud models by:
Count the raster slices with a Counter (gives each slice a nice ID)
Use a RasterCellValueReplacer to threshold the data, setting all values below some value to 0
Use a RasterBandNodataSetter to make 0 a nodata value
Use a RasterBandInterpretationCoercer to make the band into a numeric band (probably real32 or real64).
Use a RasterCellValueReplacer to set all nondata values to Value(_count)*SliceThickness (this makes it into a raster of heights rather than of colors).
Send all these features to a PointCloudCombiner, which creates points for each raster cell at the height given in the numeric band, and at the xs and ys given by the original xy dimensions of your rasters.
You may be able to post-process with a TINGenerator, or some other technique like those given here:
We use 3 different kinds of cookies. You can choose which cookies you want to accept. We need basic cookies to make this site work, therefore these are the minimum you can select. Learn more about our cookies.