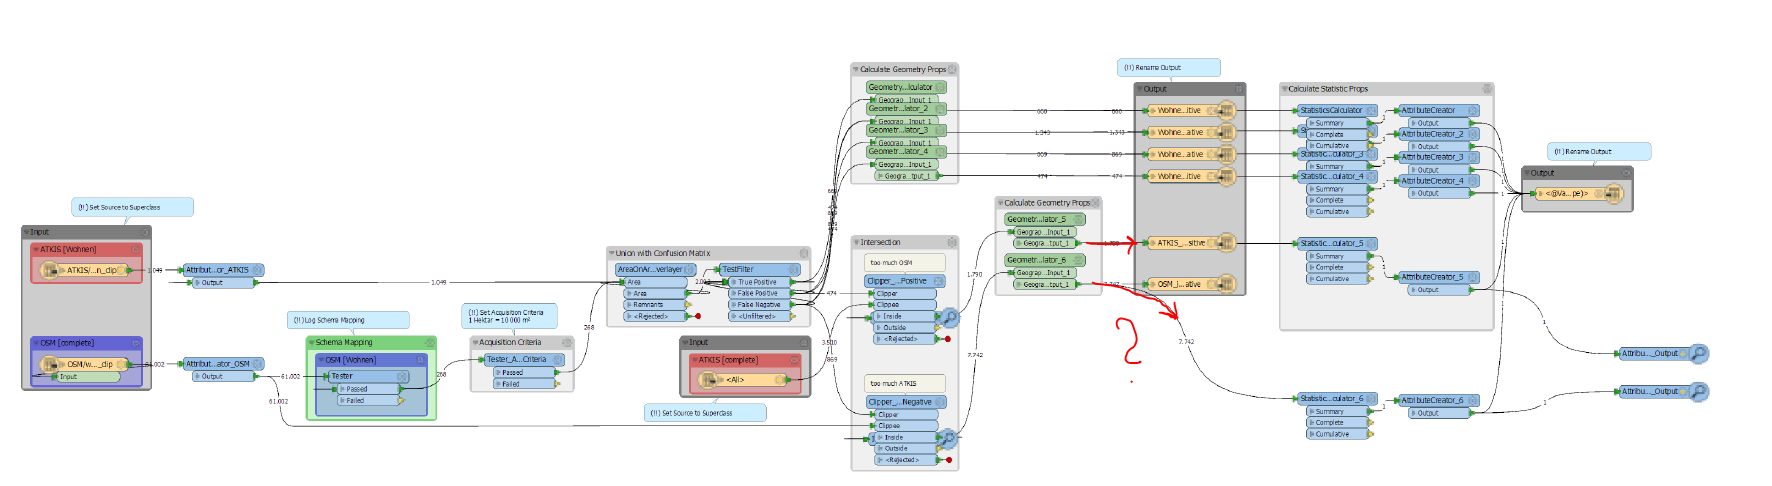
As a part of a study project, two different data sets are to be compared (official data and free data). The comparison is modeled successfully (see image below).
In addition, I would like to produce an overview that shows me which categories of a data set are in the wrong category of the other data set >> like a advanced Confusion Matrix.
For this I use currently the StatisticsCalculator, which gives me the name and the feature count of the "wrong" categories. I would like to expand this list attributes by the total amount of the area (sum(area_category[i]).
The result, a list with the contents .name, .count and .areaSum should be to output as XML file.
I do not get these two steps modeled without further help. Are there any suggestions?Thanks in advance Greetings from Mainz (Germany)