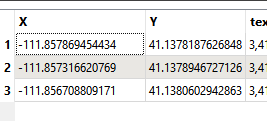
I have a series of text files that I am trying to create lines from. Each row in the text file has the number of vertices followed by the Y coordinates for all the vertices and then the x coordinates for all the vertices (see example below)
Does anyone know how I could break these up into an X,Y format to use something like the LineBuilder to create lines?
Thanks!
Best answer by ebygomm
One possible way to get pairs of coordinates
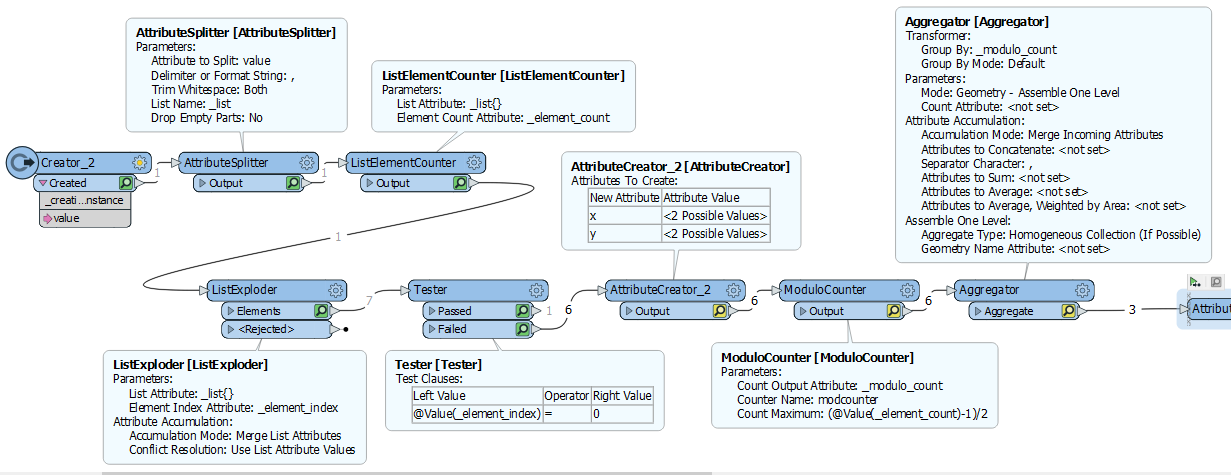
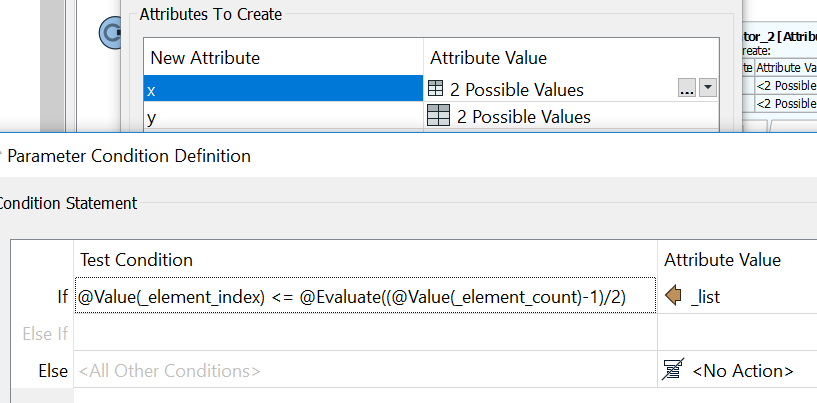
Split into a list by the comma, count the length of the list, explode the list into parts, discard the first item in the list (the number of coordinates), create an x attribute if the element index is less than or equal to half the element count -1, create a y attribute if the element index is more than half of the element count -1, use a modulo counter to assign a coordinate index, aggregate together to get coordinate pairs
You could then create points and use a point connector make lines
In reality though, I'd probably use a pythoncaller to create the geometries, something like this
import fme
import fmeobjects
defprocessFeature(feature):#get value, split on comma to get list and remove first value, convert to floats
mylist = [float(i) for i in feature.getAttribute('value').split(',')]
#get num coordinates
numcoords = int(mylist[0])
#get first n items in list (excluding first)
y = mylist[1:numcoords+1:]
#get last n items in list
x = mylist[numcoords+1::]
#create list of tuples
coords = list(zip(x,y))
#set geometry
feature.setGeometry(fmeobjects.FMELine(coords))
Split into a list by the comma, count the length of the list, explode the list into parts, discard the first item in the list (the number of coordinates), create an x attribute if the element index is less than or equal to half the element count -1, create a y attribute if the element index is more than half of the element count -1, use a modulo counter to assign a coordinate index, aggregate together to get coordinate pairs
You could then create points and use a point connector make lines
x and y need to be the other way round of course, now I've noticed you say y coords first but same principle
Split into a list by the comma, count the length of the list, explode the list into parts, discard the first item in the list (the number of coordinates), create an x attribute if the element index is less than or equal to half the element count -1, create a y attribute if the element index is more than half of the element count -1, use a modulo counter to assign a coordinate index, aggregate together to get coordinate pairs
You could then create points and use a point connector make lines
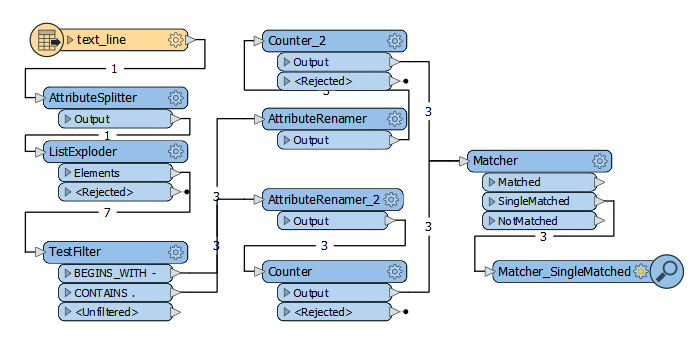
Thank you, your response helped a ton! I had multiple rows, so I made a few adjustments:
Added a Counter before the List Exploder
Used the Counter and the coordinate index (Modulo Counter) in the Aggregate group by parameter
Added a Vertex Creator, Sorter (sort by _count and _element_index), and Line Builder (group by Counter)
We use 3 different kinds of cookies. You can choose which cookies you want to accept. We need basic cookies to make this site work, therefore these are the minimum you can select. Learn more about our cookies.