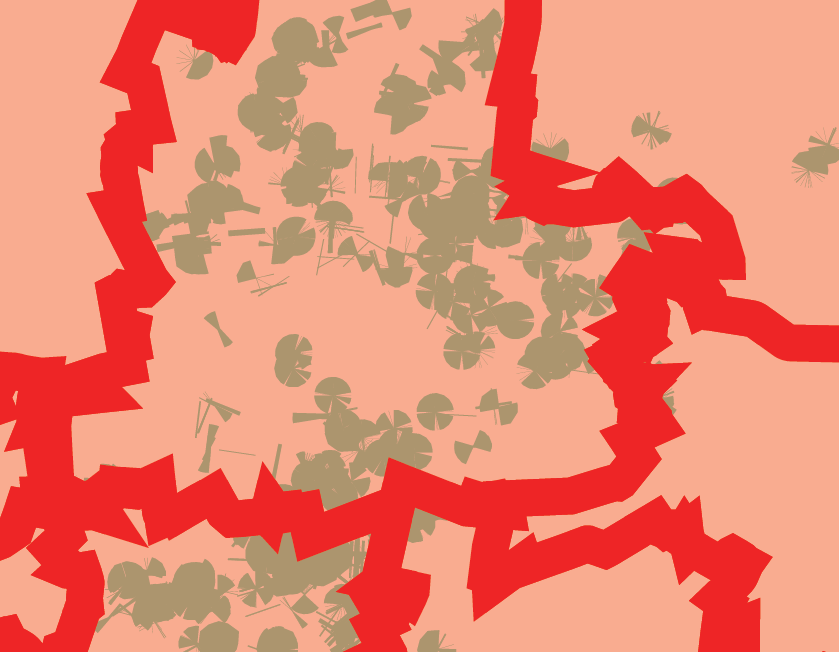
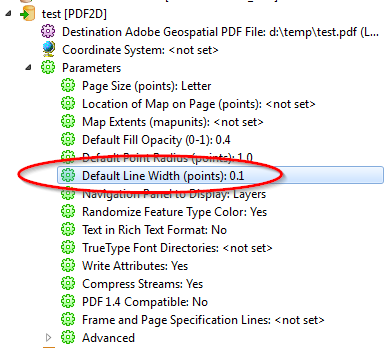
I'm trying to create a pdf file to visually represent some basic shape files I have. Using the Adobe geospatial PDF writer, everything seems to be fine. Until you zoom in a bit, then you see this:

The red lines are some simple boudary polygons, that aren't normally as spikey and those green "pie charts?" are roads, standard roads. These exact layers display perfectly fine in ArcMap, so I'm very confused as to where these strange geometrical anomalies come from.
At this point I'm not even using any transformers, so it's a basic reader to writer translation. Any tips on what I might need to fix this, or even a suggestion on an alternative output format that's good for display purposes?
Kind Regards,


