Question

Using Kibana to monitor FME logs

  • October 12, 2017
  • 2 replies
  • 58 views

bo
Contributor
Forum|alt.badge.img+10
  • Contributor
  • 79 replies

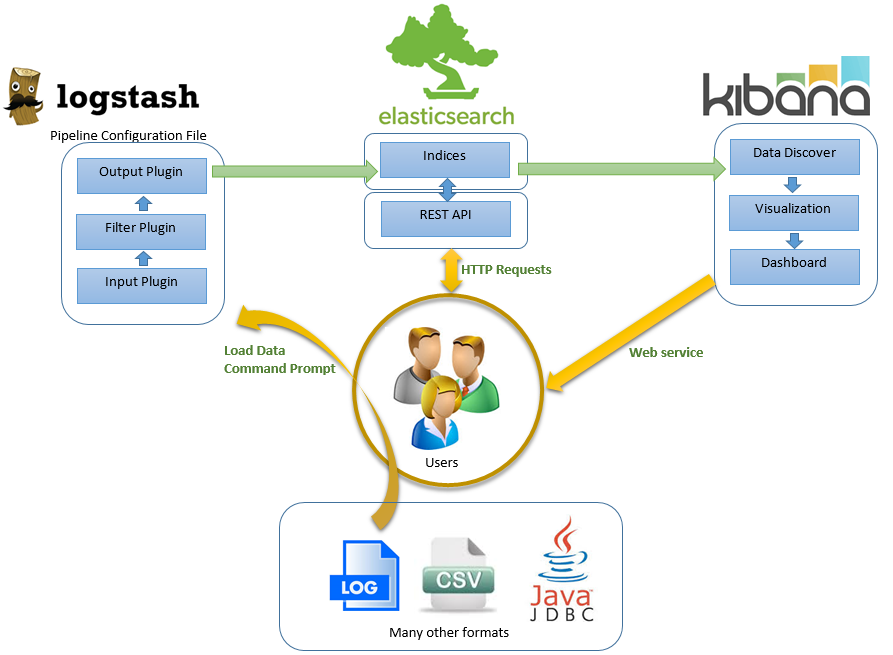
I am wondering if someone can share your experience of pulling certain fme server logs into an elasticsearch database and using Kibana to monitor / analyse the activities in the logs.

This post is closed to further activity.
It may be an old question, an answered question, an implemented idea, or a notification-only post.
Please check post dates before relying on any information in a question or answer.
For follow-up or related questions, please post a new question or idea.
If there is a genuine update to be made, please contact us and request that the post is reopened.

2 replies

pallegama
Contributor
Forum|alt.badge.img+8
  • Contributor
  • 25 replies
  • October 13, 2017

Hi @bo,

I have done some testing year ago using Elasticsearch 2.2.0, Logstach 2.2.0 and Kibana 4.4.0.

The process may be changed slightly with new version of Elasticsearch. Anybody use Elasticsearch recently can update this process.

What I did with older version of Elasticsearch is depicted in the diagram below.

I created a 'Pipeline Configuration File' (please see the attached sample) in Logstash to extract required information from a CSV file. Then Elasticsearch to create indices which can be utilized by Kibana for data discovering, Visualization and Dashboard.

I followed the Elasticsearch documentation at https://www.elastic.co/guide/index.html

for building the process.

Hope this helps you.

fmeserver-analytics.zip


bo
Contributor
Forum|alt.badge.img+10
  • Author
  • Contributor
  • 79 replies
  • October 13, 2017

Hi @bo,

I have done some testing year ago using Elasticsearch 2.2.0, Logstach 2.2.0 and Kibana 4.4.0.

The process may be changed slightly with new version of Elasticsearch. Anybody use Elasticsearch recently can update this process.

What I did with older version of Elasticsearch is depicted in the diagram below.

I created a 'Pipeline Configuration File' (please see the attached sample) in Logstash to extract required information from a CSV file. Then Elasticsearch to create indices which can be utilized by Kibana for data discovering, Visualization and Dashboard.

I followed the Elasticsearch documentation at https://www.elastic.co/guide/index.html

for building the process.

Hope this helps you.

fmeserver-analytics.zip

@pallegama, nice ELK implementation! A couple more questions:


  1. If we are only interested in FME server logs, is it possible to use FME server to ship the logs to Elasticsearch in lieu of Logstash?
  2. How do your send alert emails / text msgs to administrator when certain conditions are met?
Thanks!