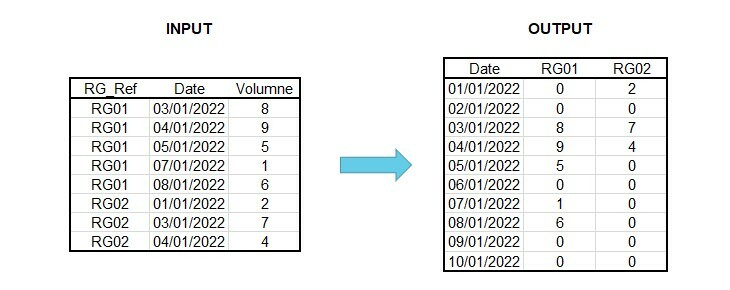
 I'm attempting to transform the input Rain Gauge data set to the desired output as shown in the above inserted image but I'm at a loss on how to proceed?
The important factors are:
- The time period is defined by the user, in this example 01/01/2022 - 10/01/2022 and the output table needs to include all days in that range.
- The input Rain Gauge data only contains data for when it rained so not all dates are included.
- I need to some how produce a column per Rain Gauge reference, then look up the associated rain fall value for each of the days and populate the new table structure.
- The number of rain gauges can vary.
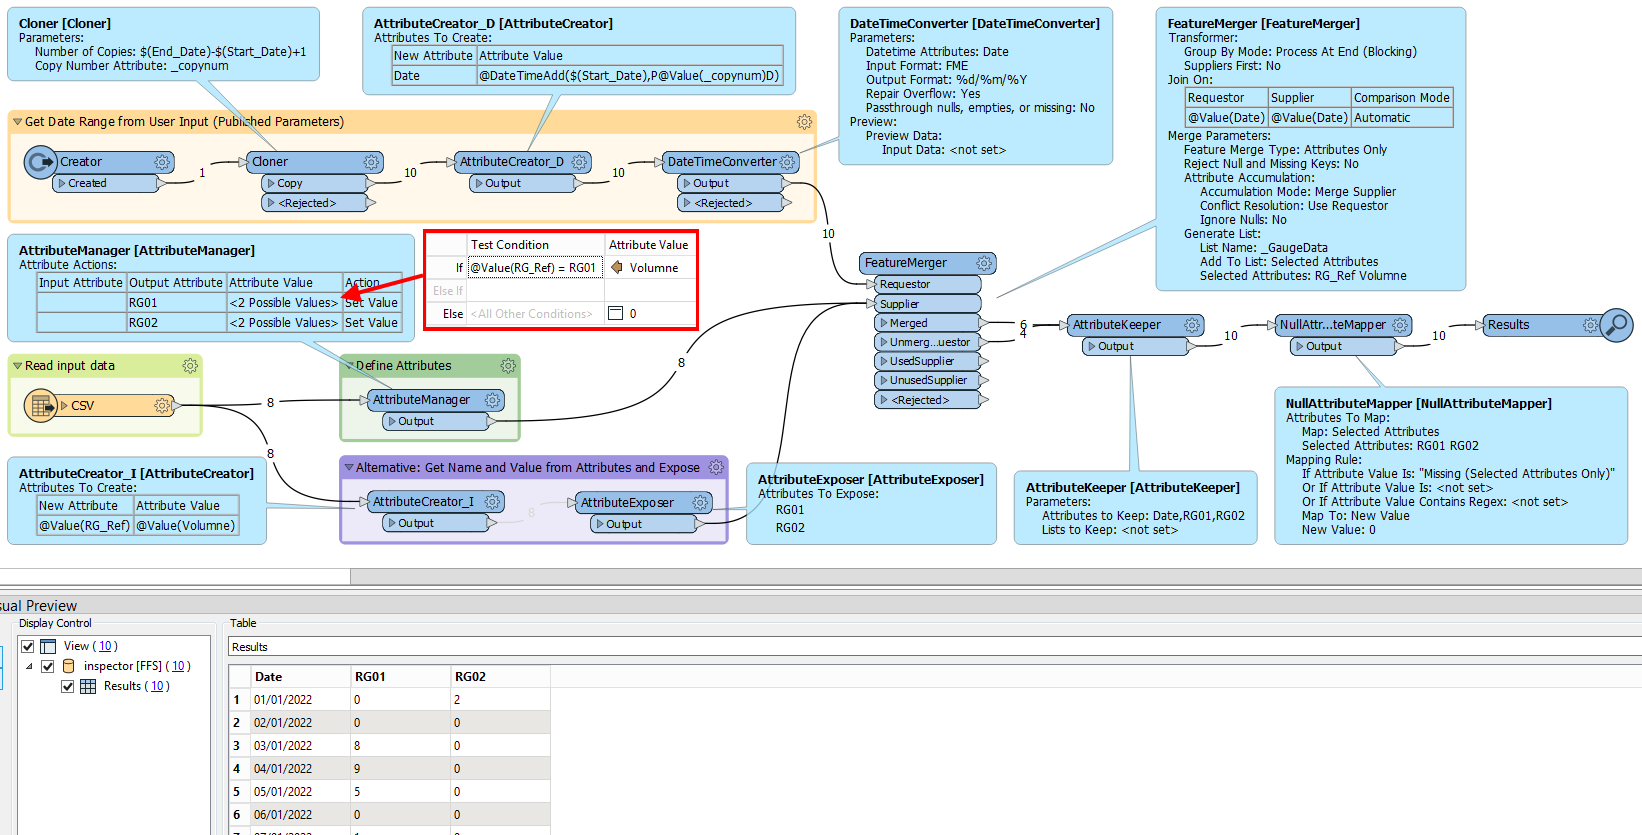
I have completed the process of creating a list of all dates for the requested time period.
I can't begin to fathom how to manipulate the data as shown and explained above.
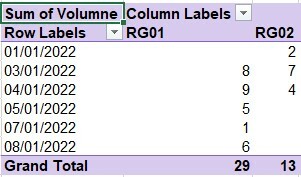
If completing this in Excel I would have created a pivot to produce the table below:

Any help will be gratefully received!
Thank you.


