An example would be a spreadsheet with 2 columns such as

Neighborhood activity

A Repair

B Install

A Repair

B Remove


Ideally, I could get output grouped by Neighborhood (A and 😎 and show the Activity values as column headers such as

Neighborhood Activity.Total.Count Repair.count Install.count Remove.count

A 2 (activities total) 2 (repairs) 0 (installs) 0 (removes)

B 2(activities total) 0 (repairs) 1 (installs) 1 (removes)


Should I expect to be able to do this with FME Statistics Calculator? If I need to use a parameter, I don't know how..

Any guidance would help.

thanks

Jim

Yes it can, but I think you will also need to do some attribute configuration afterwards using an AttributeCreator and Aggregator. I've attached a workspace with a possible solution. How does that look?

image


Thank you! I will be trying this out today asap.. meanwhile, thanks for the response and for troubleshooting with me. I'm a relative newbie in FME.. a quick learner with lots of questions.

I will follow up here.


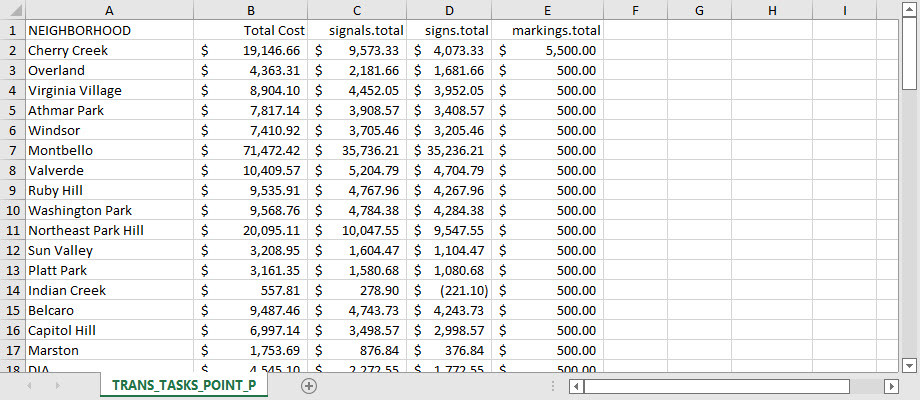
My example showed one part of my objective wrong.. i've made a more realistic example. I am trying to show the cost per asset type per neighborhood.. The screenshot (with some fake numbers) shows total cost per neighborhood, and the next 3 columns are the break-out of the asset type column (not shown).. the result is to show the cost of each asset type in each neighborhood.. (they should add up to the total which is shown).

I am trying your workflow from above, but think that my incorrect example up front may change how it works. I'm going to keep trying things here. Any ideas are welcome.

Thank you

Jim

workflow example


This answer from Natalie at Safe.com was exactly what I was looking for. I used this workbench example and made it work for my data and it is AWESOME. Thank you Natalie at Safe! It seems appropriate to share the workflow for others to benefit from in such a situation. It's better explained by her - I will past the explanation below:

>>>>>>

In reading the additional details you provided therein, I was able to make a couple of adjustments to that template workflow that I forwarded before. Please find attached this updated workflow. There is likely a more elegant way to achieve your needed end-state, however the method in this updated template seems to work well for reformatting your spreadsheet-style data.

Essentially, the new workflow (contained within the green bookmark) takes my new test data, which now has cost associated with each task, and calculates two statistics: the total cost of each activity by neighborhood (the top StatisticsCalculator), and the total cost of all activities performed within a neighborhood (the bottom StatisticsCalculator). The Sorter, ListBuilder, and AttributeExposer are there to reformat the columns so that you get a column for each of Neighborhoods, TaskACost, TaskBCost, TaskCCost. Then the <missing> values, for those activities that were not performed at all in a neighborhood, are assigned a value of zero by the NullAttributeMapper. Finally, the TotalCost statistic is brought in by the FeatureMerger. This should give you a column for Neighborhoods, each task's cost in the neighborhood, and total cost of all tasks performed in each neighborhood. 

Again, there's likely a much prettier way of arriving at the desired output, and you may discover shortcuts for this process as you work with it. But, this should get you started.

>>>>>>>>

This was my first experience using the ListBuilder and AttributeExposer, so it was an even bigger success for me.

Thanks

Jim


Yes it can, but I think you will also need to do some attribute configuration afterwards using an AttributeCreator and Aggregator. I've attached a workspace with a possible solution. How does that look?

image

Thanks for your solution.. I did not explain my issue very well. Below is a better explanation and a spot-on fix for the challenge I encountered. Now I know more about FME, that's for sure!


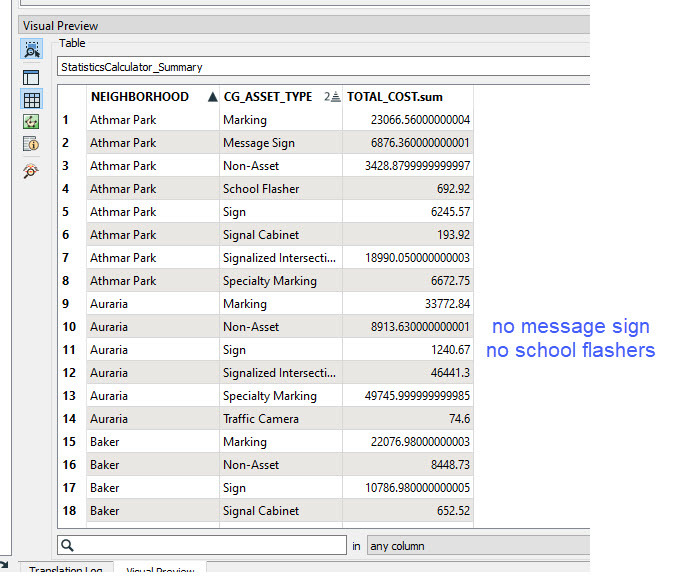
I spoke too soon.. It turns out that the way it's configured above only works if every record grouping (neighborhood) has the exact same number of records to make the same sequence of lists .. in this case, if each neighborhood has a record for signals, signs and markings then we are OK... but if another neighborhood has a record/row for Cameras - the list builder may not work as expected.. the cameras total will end up in the signals column or some such confusion. I have 78 neighborhoods, and any one of them may only have values that fit into 5 or 6 of these columns.. so this isn't working.

I will have to go back up the workflow chain and try to find out where or how to account for all lists that need to be created - because it does not appear to be working.. Good thing I caught that.. I started to publish my maps already.

It's a good workflow, but the data presented some complicating circumstances.list issueThis is almost exactly shown in the FME Help example ..
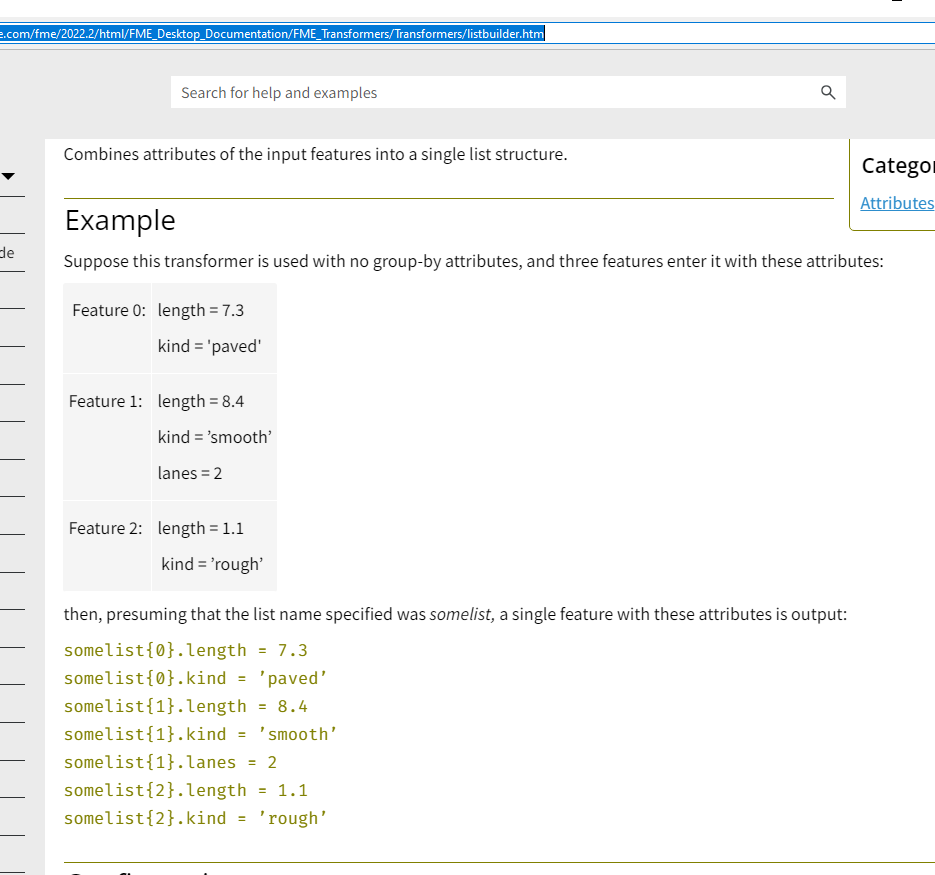
Using that example, if I wanted to put the Length value into one list - it would not work as shown, because each feature shown has inconsistent numbers of rows for each feature. Length could wind up in list 0 or 1 depending on the record. I'm looking for a way to put all Length (using the example) into a list which results in a field called Length and has the Length for each feature in that column.. and the other columns would handle the other values consistently.

list builder example 2


Reply