Result unexpected by Static Calculator
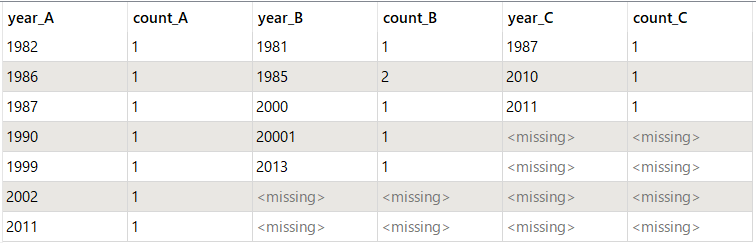
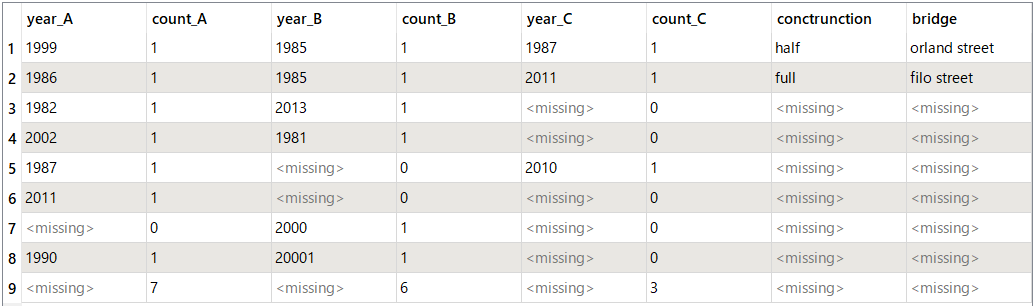
i have A B C Columns,each column has different years so i want to count how many year duplicate or not in each column and sum the count attribute at the end
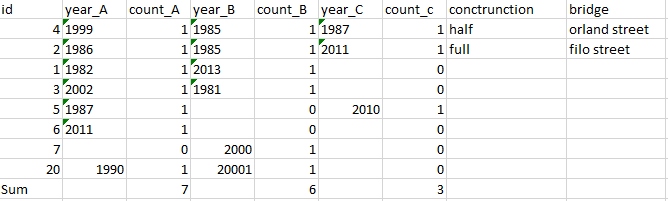
so i should do count and sum for each column A B C and get table as result for 3 column in one table beside eachother .
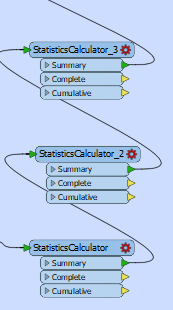
so what i did exactly i used 3 static calculator and each one i defined count and analyze to attribute and output of first a input for second and output of second as input for third but i found the result is incorrect but if i used two static calculator ,the result is erfect but only for 2 columns but i want to do for 3 column .
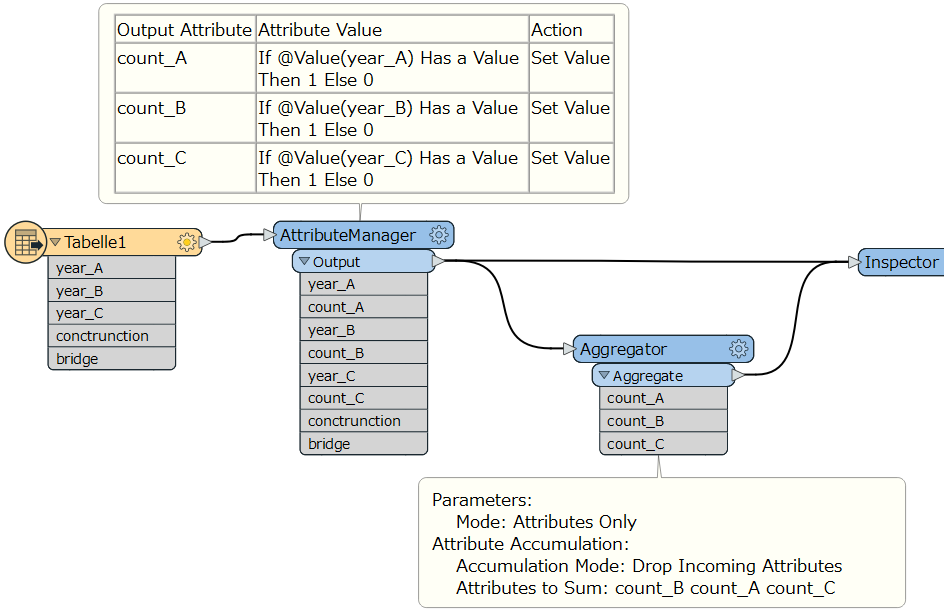
then i used aggregator to sum the count
Does we have a way to use one static calculator and do sum for 3 columns and count once a time
i want to count each the first 3 columns for year and get the sum of each count but i do not want to count empty cell if exist.Thanks
.Thanks