Solved

Problem drawing polygon that crosses the 180th meridian

  • February 14, 2017
  • 9 replies
  • 384 views

Hello everyone,

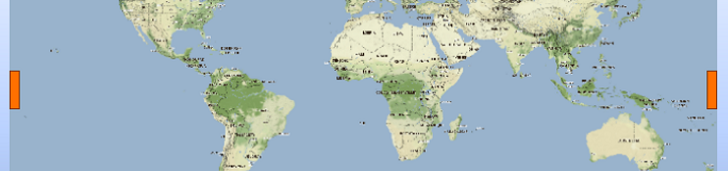
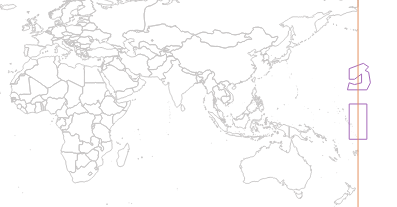
I want to draw a polygon that crosses the 180th meridian and obtain this geometry (created manually, splitting the feature into two separate polygons):


Instead I obtain this:


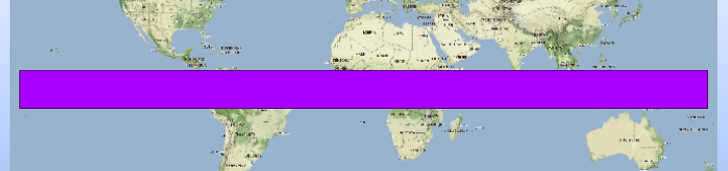
I don't understand why the geometry won't generate properly. FME creates the polygon with the greatest distance between points instead of the shortest.


I have to do this for many polygons and also lines, with much more complex boundaries, so I can't do this manually like this one.


Any idea on how I can achieve this?

Here is the workspace I used to generate these geometries:

Thank you very much

Best answer by david_r

Rather than using "LL-WGS84" as your projection, try using "LL-360" and see if it helps.

LL-360 was mistakenly deprecated in FME 2015-16, so you need to type it in instead of choosing it from the Gallery. It is the same as LL84, but with the bounds set to 0 <-> 360 instead of -180 <-> 180, so it won't wrap features near the date line.

View original
Did this help you find an answer to your question?

9 replies

david_r
Celebrity
  • Best Answer
  • February 14, 2017

Rather than using "LL-WGS84" as your projection, try using "LL-360" and see if it helps.

LL-360 was mistakenly deprecated in FME 2015-16, so you need to type it in instead of choosing it from the Gallery. It is the same as LL84, but with the bounds set to 0 <-> 360 instead of -180 <-> 180, so it won't wrap features near the date line.


  • Author
  • February 14, 2017
david_r wrote:

Rather than using "LL-WGS84" as your projection, try using "LL-360" and see if it helps.

LL-360 was mistakenly deprecated in FME 2015-16, so you need to type it in instead of choosing it from the Gallery. It is the same as LL84, but with the bounds set to 0 <-> 360 instead of -180 <-> 180, so it won't wrap features near the date line.

Thank you for your comment but I just tried it and got the same result.


Wouldn't I have the same problem with LL360 around Greenwich meridian?


david_r
Celebrity
  • February 14, 2017

I wonder if this is an issue with the Data Inspector or a more general one. What happens if you save your data to e.g. a File Geodatabase and visualize it in ArcMap?


david_r
Celebrity
  • February 14, 2017

Btw, have a look at this blog post and see if it helps: http://blog.safe.com/2009/03/orientation-and-geodetic-data-part-2/

Edit: Here's a much more recent one: https://knowledge.safe.com/articles/34013/dateline-problem.html


mark2atsafe
Safer
Forum|alt.badge.img+44
  • Safer
  • February 14, 2017
david_r wrote:

I wonder if this is an issue with the Data Inspector or a more general one. What happens if you save your data to e.g. a File Geodatabase and visualize it in ArcMap?

I think this is probably the most likely issue. For example, if I write that data to KML, the KML file contents are this:


<coordinates>175.0,-10.0,0.0 175.0,10.0,0.0 -175.0,10.0,0.0 -175.0,-10.0,0.0 175.0,-10.0,0.0</coordinates>


So that's OK, but Google Earth represents it in the "invalid" way that you have pictured above. So, for KML at least, what you would do is set the +175 coords to -185.


<coordinates>-185.0,-10.0,0.0 -185.0,10.0,0.0 -175.0,10.0,0.0 -175.0,-10.0,0.0 -185.0,-10.0,0.0</coordinates>


That way Google Earth shows the polygon correctly.


So, it really depends on what you want to do with this data. FME will generally write out the coordinates correctly to a dataset, but most visualization tools differ in whether and how they will handle it. If you can tell us what your destination dataset is, that would help us to figure out if this is possible.


mark2atsafe
Safer
Forum|alt.badge.img+44
  • Safer
  • February 14, 2017
Ironically (or maybe I mean coincidentally) this question was also raised on GIS StackExchange just now: http://gis.stackexchange.com/questions/228393/how-to-avoid-this-corrupted-world-render


redgeographics
Celebrity
Forum|alt.badge.img+49

Ah, the cartographer's nemesis... There's a few landmasses that cross the 180/-180 degree line (Siberia, Fiji and Antarctica) and they're always causing trouble.

I'm not sure whether any of this is an actual solution to this issue, but I'm sharing it anyway:

One trick I sometimes employ is clipping the data to a box from -180,-90 to 180,90, that generally sorts out any rounding errors.

Another thing I do on globes (when I start out with a gore centered on the Greenwich meridian I inevitbably end up with one centered on the 180/-180 line is clip half of my data and offset it by 360 degrees, basically sticking it back on the other side. The software I use to make my maps is smart enough to work with that. This is similar to what @Mark2AtSafe suggests.

Hope this helps.


  • Author
  • February 15, 2017
david_r wrote:

I wonder if this is an issue with the Data Inspector or a more general one. What happens if you save your data to e.g. a File Geodatabase and visualize it in ArcMap?

I guess it was a problem with the Data Inspector as when I exported the data into a postgis table and visualized it in Qgis I got this:


I then created this workspace, using DaveAtSafe's article to obtain the geometry in the way I wanted it: 180th-meridian.fmw


I'm sure it can be done way more efficiently, but it works for what I'm trying to achieve, so that's a first step!


Thank you all very much


Forum|alt.badge.img
  • February 17, 2017

I'd use NZGD2000 (EPSG:2193). Its primary meridian runs through New_Zealand, so no trouble on the edges here.


Reply


Cookie policy

We use cookies to enhance and personalize your experience. If you accept you agree to our full cookie policy. Learn more about our cookies.

 
Cookie settings