I need to generate a list of polygons from Dataset Y that overlap with Dataset Z and the percentages each polygon overlaps the polygons in the other dataset.

I’ve currently used a spatial relator > list concatenator to find overlapping polygons but it then requires a lot of additional work in excel to get it into a usable table so I am not getting results in the format I need.

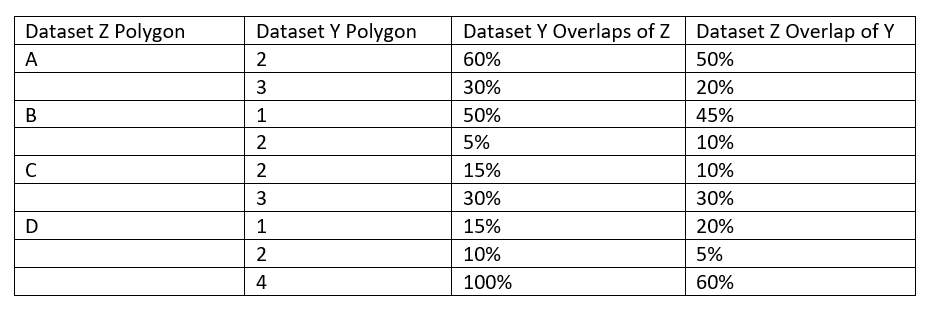
The data essentially looks like the follow example and I need something similar to the Ideal Resulting Dataset or in a format that is easy to follow or easy to turn into that dataset.

Example 

Dataset Y

1

2

3

4


Dataset Z

A

B

C

D


Spatially Datasets Y and Z:
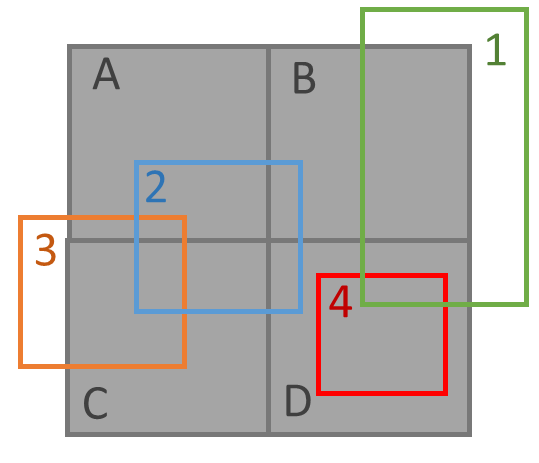
Picture1

Ideal Resulting Dataset:

Picture2

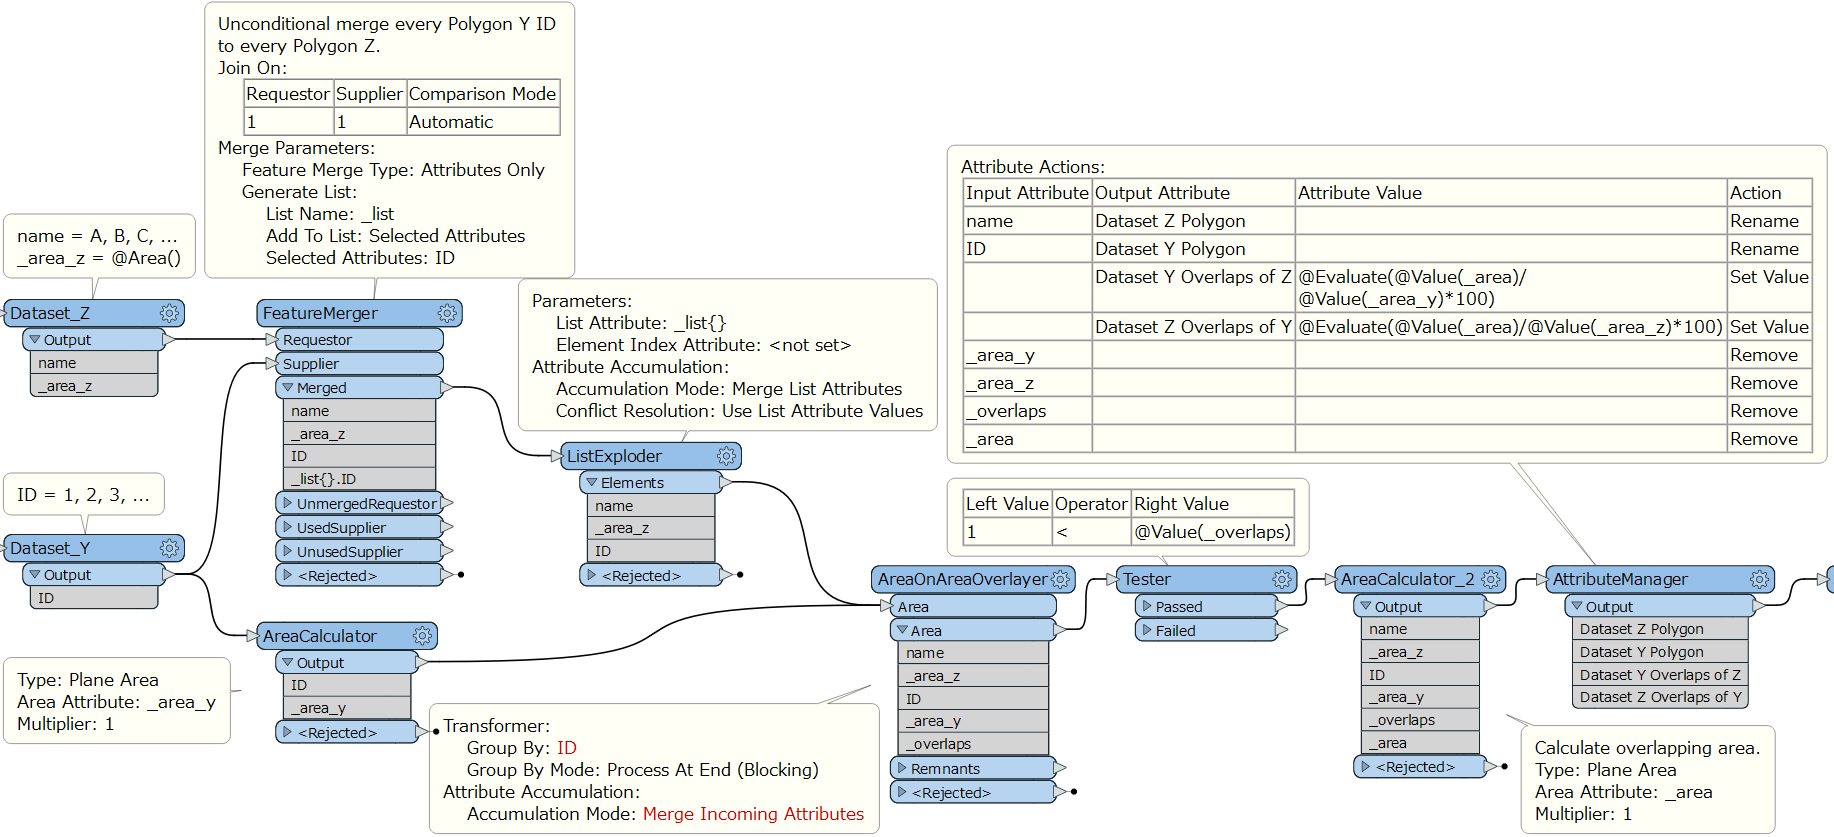
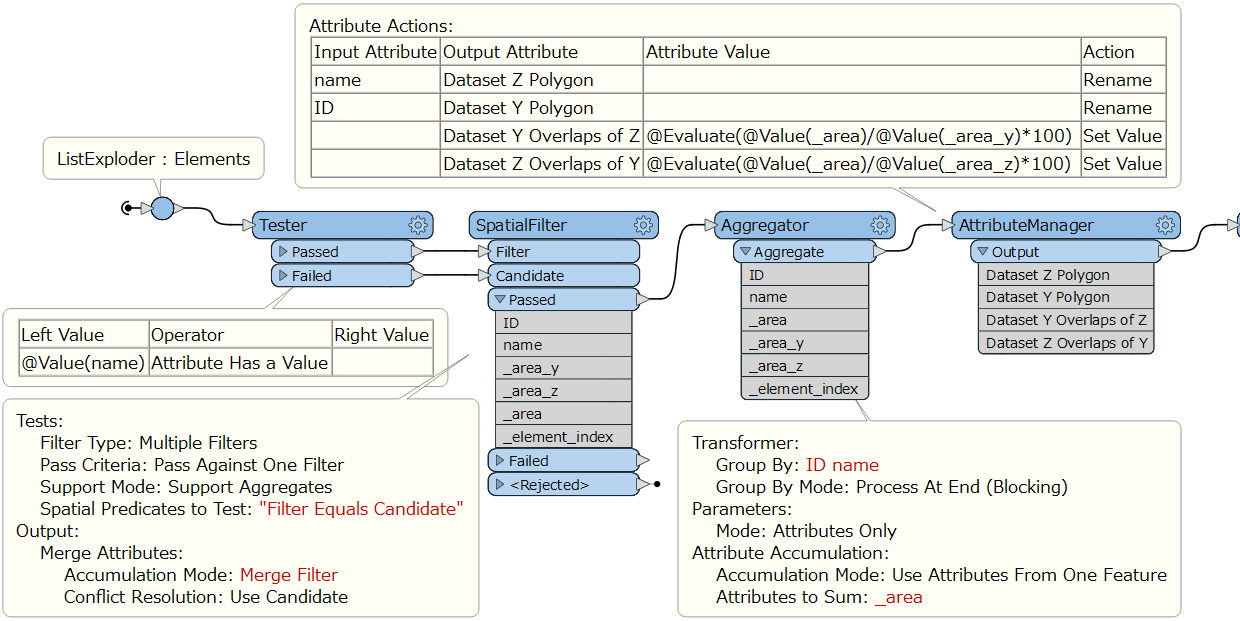
Hi @bek​ , hopefully this workflow works for you. Assuming that polygons belonging to Dataset Z don't overlap each other.

workflow

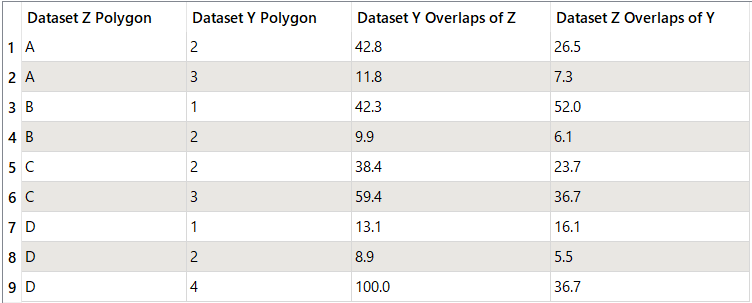
Result (sorted and rounded)

result


Hi @bek​ , hopefully this workflow works for you. Assuming that polygons belonging to Dataset Z don't overlap each other.

workflow

Result (sorted and rounded)

result

Thanks so much @Takashi Iijima​ ! I have tried to run it overnight but ran out of memory so am trying again with feature caching off to see if that helps. It takes a really long time to run even though the data isn't that big (starts with 244 and 607 features with the list exploder creating 145,205 features from the dataset with 244 features). If there is overlaps in Dataset Z what would happen? Generally they don't overlap but it is likely overlaps will exist.


Hi @bek​ , hopefully this workflow works for you. Assuming that polygons belonging to Dataset Z don't overlap each other.

workflow

Result (sorted and rounded)

result

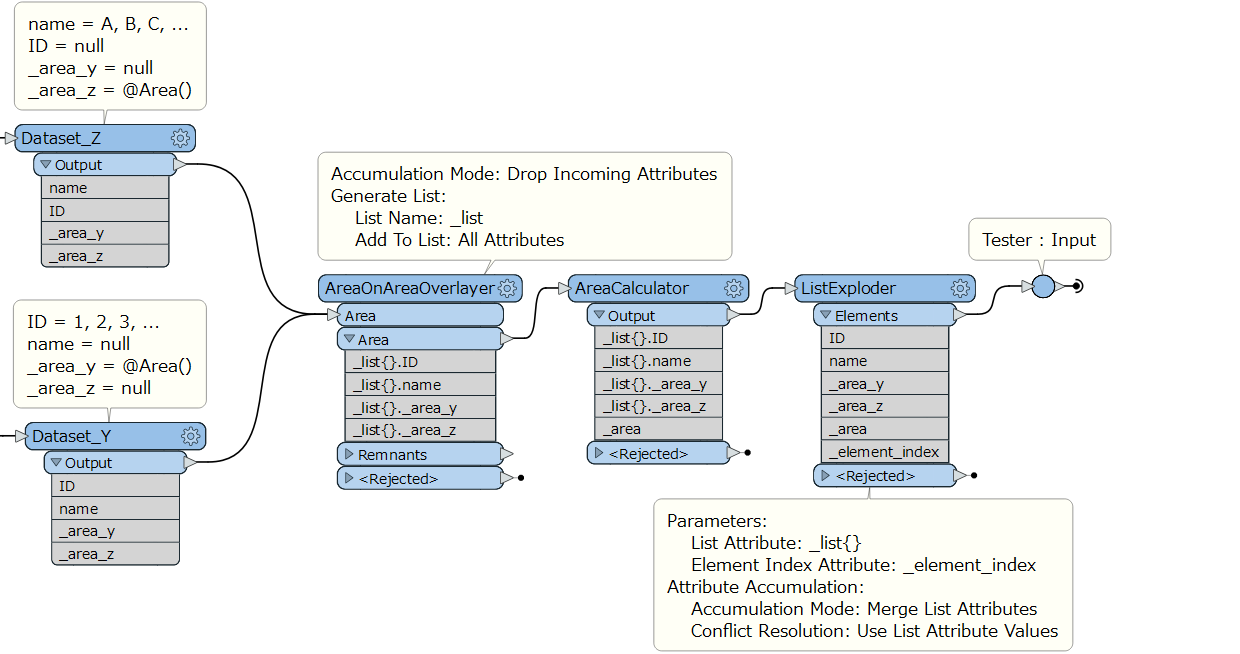
Another approach.

workflow-2-1

workflow-2-2


Another approach.

workflow-2-1

workflow-2-2

Thanks Takashi, it's been very useful. Clean !


Reply