I just ran a workspace in Workbench 2019 to analyse software concurrent usage data. Basically the dataset contains a feature for each instance a user fires up a piece of software and includes a start and end time. The dataset only covers 4 or so weeks and has 55,466 features...not huge by any means.
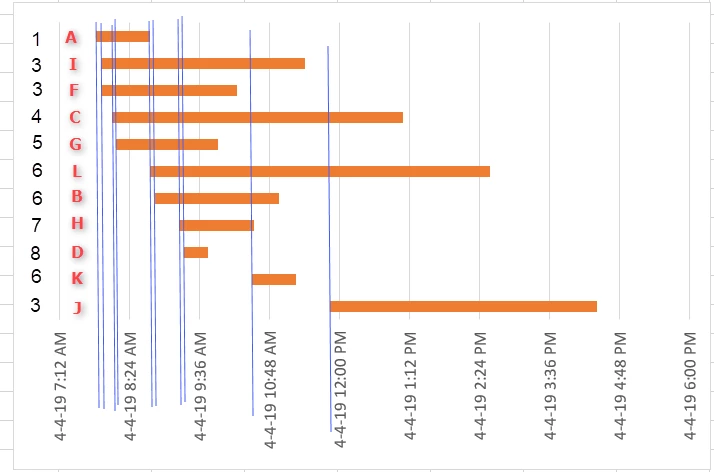
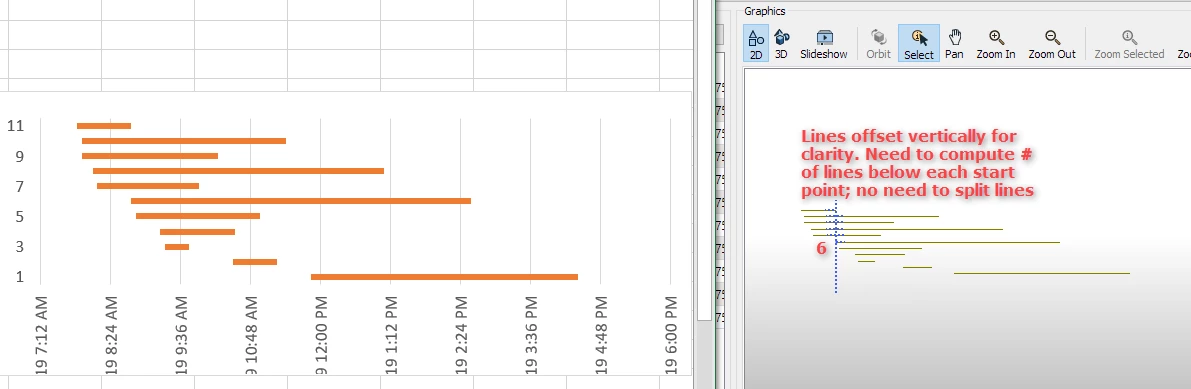
To solve this problem I plotted points for each start time and lines by using the end time as the 2nd coordinate (y=0, X1=Start, X2=End). Essentially this produces a Gantt chart with all lines and points on the X axis. Then I use the PointOnLineOverlayer to find how many lines lie under each start point, which gives the number of users at each point in time. Sorting for that count then gives the maximum concurrent usage.
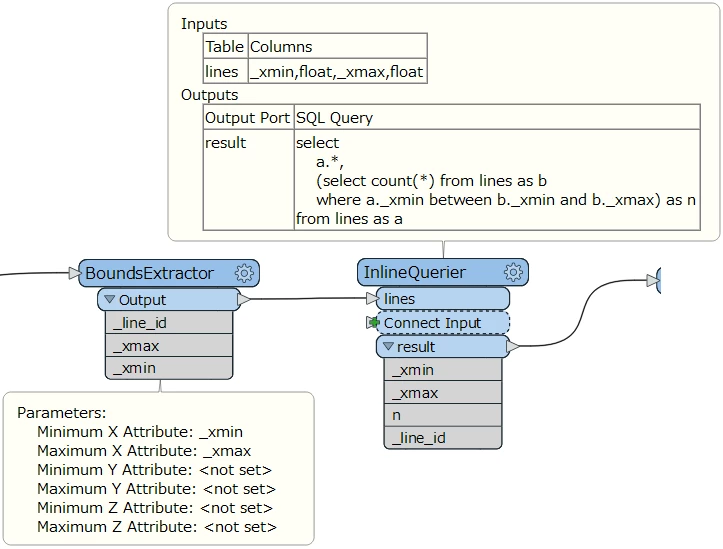
The problem however is that this transformer splits each line by the point above it FIRST, before it processes the points output. So I ended up with 31,829,560 new line features that I really don't need! As a consequence, it took 5 hours & 14 minutes to run the workspace, with the biggest chunk wasted on things I didn't need. I only needed a list of some (original) line attributes assigned to the intersecting points.
Is there an alternative? Maybe this is a good use case for an idea post on enhancing this transformer to toggle the line-splitting functionality/output if not needed?...thoughts welcome! Thanks.