Output data required is more like the following - shape polygons
Â
The numbers are a count of the occurances per district,
Â
District¦A¦B¦C¦Red¦Amber¦Green
Â
AreaA¦254¦164¦170¦584¦363
Â
AreaB¦634¦636¦563¦255¦346
where does the district relate/link to the data? (shape to tabular data link)
Hi,
Â
Â
I would use a StatisticsCalculator and a simple Tcl script.
Â
After migrating the input data 1 to the data 2:
Â
Â
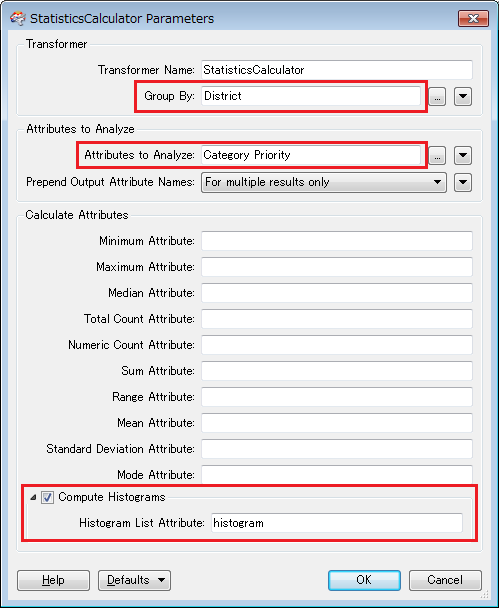
1) Send the distric polygons to a StatisticsCalculator to create histograms.
Â
Group By: District
Â
Attributes to Analyze: Category, Priority
Â
Histogram List Attribute: histogram
Â
Â
The StatisticsCalculator creates histograms for each attributes, like:
Â
Category.histogram{
n}.value: stores a Category values (A, B, or C)
Â
Category.histogram{
n}.count: stores the number of the value occurences.
Â
Priority.histogram{
n}.value: stores a Priority values (Red, Amber, or Green)
Â
Priority.histogram{
n}.count: stores the number of the value occurences.
Â
Â
2) Connect a TclCaller to the Summary port of the StatisticsCalculator. This script example will create new attributes whose names are the original attribute values; their values will be the number of occurences.
Â
-----
Â
proc pivot {} {
Â
  set attributes {"Category" "Priority"}
Â
  foreach {attr} $attributes {
Â
    for {set i 0} {1} {incr i} {
Â
      set newAttr ÂFME_GetAttribute "$attr.histogram{$i}.value"]
Â
      if .string equal $newAttr {}] {break}
Â
      FME_SetAttribute $newAttr ÂFME_GetAttribute "$attr.histogram{$i}.count"]
Â
    }
Â
  }
Â
}
Â
-----
Â
In this method, you can add other attributes easily without adding any other transformers. That is, just add required attribute names to the "Attributes to Analyze" parameter of the StatisticsCalculator and the "attributes" list defined at the first line of the script.
Â
Â
After the TclCaller, you can expose the new attribute names (A, B, C, ... Red, Amber, Green, ...) with an AttributeExposer, if necessary.
Â
Â
Takashi
In addition, the Tcl script example assumes that there is no empty value in the original attributes. If there could be empty attributes, the script should be improved.
Â
You can also use the "Attributes to Expose" parameter of the TclCaller To expose the new attribute names.
Â
And, of course, a PythonCaller can be used as well.
Â
-----
Â
# Python script example
Â
def pivot(feature):
Â
  attributes = b'Category', 'Priority']
Â
  for attr in attributes:
Â
    i = 0
Â
    while True:
Â
      newAttr = feature.getAttribute('%s.histogram{%d}.value' % (attr, i))
Â
      if newAttr == None:
Â
        break
Â
      count = feature.getAttribute('%s.histogram{%d}.count' % (attr, i))
Â
      feature.setAttribute(newAttr, count)
Â
      i += 1
Â
-----
Thanks for the response Takashi.
Â
Â
I was wanting to take a step back and simplify this, but getting one pivoter working..
Â
Â
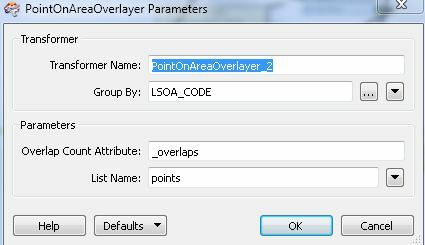
I have tried joining a points file and a shape file using PointonAreaOverlayer.Â
Â
But the Overlap count attribute is showing zero for each district.When I have checked the data and there are many points in each district.
Â
Â
Any ideas why this isn't counting the points in each polygon?
Â
Â
Sounds strange. How is the parameter setting of the transformer?
Â
looks like there are no overlaps as the _overlaps field is 0 for every LSOA_code. Seems very odd when I load the the points and shaepfiles and there are many points which overlap the shapefiles ....Â
Point on area will not propagate to the areas, i had this problem today as well. It should but it won't.
Â
I replaced it with a spatialrelator and a tester to get it propagated to the areas.
Â
Â
(seems bugged?)
Â
Anyway i had a message from safe that the spatialrelator is repaired...in fme2015beta...i think they will not put effort in repairing 2014 (?)
If you set "LSOA_CODE" to the "Group By" parameter, only points and polygons which have the same "LSOA_CODE" value will be compared. Is it your intention of the "Group By" parameter setting?
Plan B. I think this procedure is relatively efficient.
Â
Â
1) Send the polygons to the Clipper port, the points to the Clippee port of a Clipper, so that "District" will be added to inside points of each polygon.
Â
Group By: <not set>
Â
Merge Attributes: Yes
Â
Merge Attribute Prefix: <blank>
Â
Â
The PointOnAreaOverlayer or the SpatialFilter can also be used. But in my experiences, the Clipper seems to be more efficient than both of them, when transferring attributes of a polygon to inside points.
Â
Â
2) Connect a Tcl/PythonCaller to the Inside port of the Clipper.
Â
-----
Â
# Tcl Script Example
Â
proc pivot {} {
Â
  set attributes {"Category" "Priority"}
Â
  foreach {attr} $attributes {
Â
    set newAttr FME_GetAttribute $attr]
Â
    if {!rstring equal $newAttr {}]} {
Â
      FME_SetAttribute $newAttr {1}
Â
    }
Â
  }
Â
}
Â
-----
Â
# Python Script Example
Â
def pivot(feature):
Â
  attributes = /'Category', 'Priority']
Â
  for attr in attributes:
Â
    newAttr = feature.getAttribute(attr)
Â
    if newAttr:
Â
      feature.setAttribute(newAttr, 1)
Â
-----
Â
The script creates new attributes. Their names will be original attribute values (A, B, C, Red, Amber, Green); the value is 1.
Â
Â
3) Expose the new attribute names. Set the "Attributes To Expose" parameter of the Tcl/PythonCaller, or use the AttributeExposer.
Â
Â
4) Connect an Aggregator to calculate number of occurences of the new attributes for each district.
Â
Group By: District
Â
Mode: Attributes Only
Â
Keep Input Attributes: No
Â
Attributes to Sum: A, B, C, Red, Amber, Green
Â
Â
5) Merge the resulting features to the original polygons using "District" as the "Join On" parameter.
If you need to get the number of points for each polygon, specify the "Count Attribute" parameter of the Aggregator.
Came back after Christmas and followed your Plan B. and this has worked like a dream.Â
Â
Thank you very much Takashi.
Â
Happy New Year.