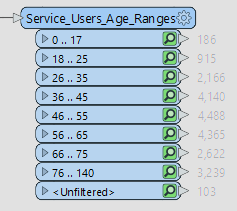
I'm sure this will be something really simple I am overlooking (as usual!)

I have some excel data of personal information, including age.

I need to:

1.       group ages, 0-17, 18-25, 26-35, 36-45 and so on.

2.       count how many each category / group has.

3.       Display data in Excel

For point 1, I have used the Attribute Range Filter
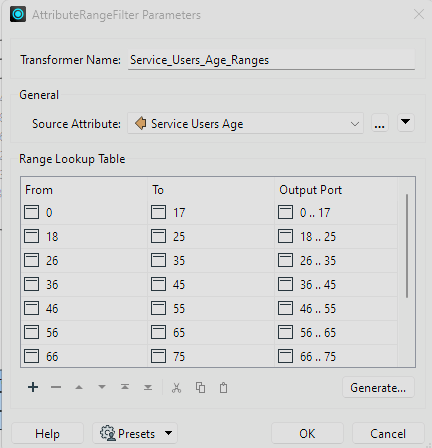
Age rangeThis gives these results

Age range filter resultsSo far so good!


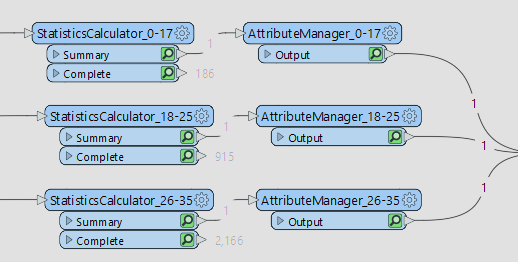
For point 2, I use the statistics calculator to do the total count of each group:
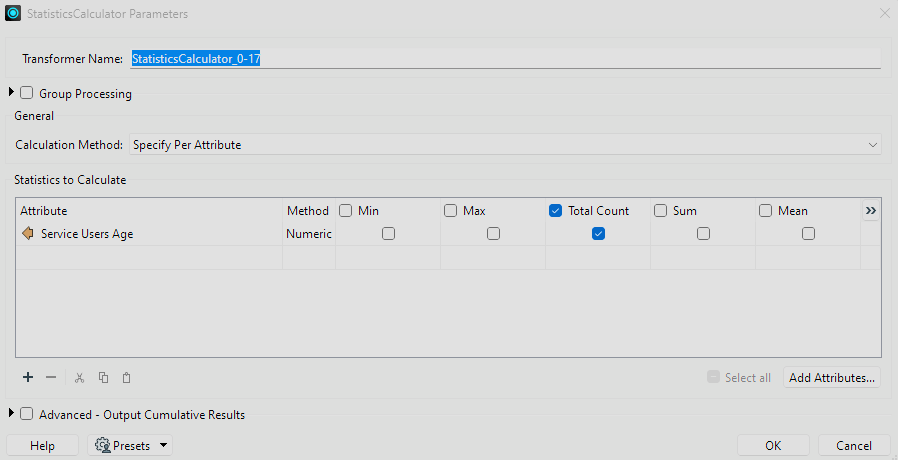
stats calcThen into Attribute manager to rename the column
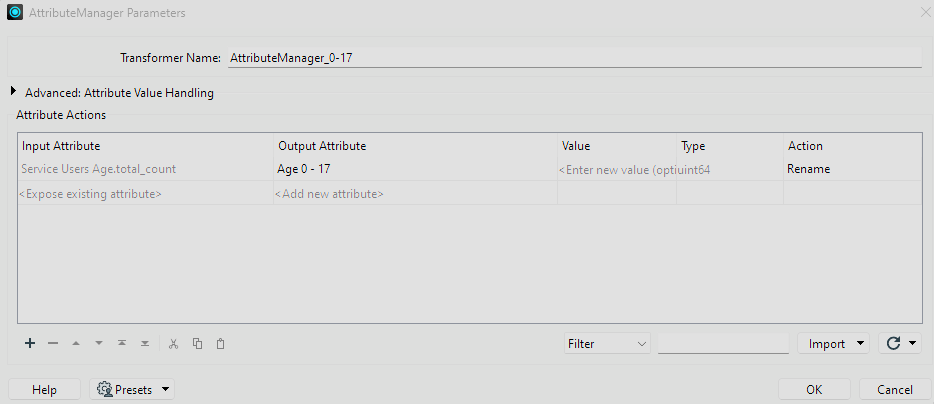
AttributeManagerStats Calc and attribute managerFor point 3, I would like it to ultimately look like this desired output:
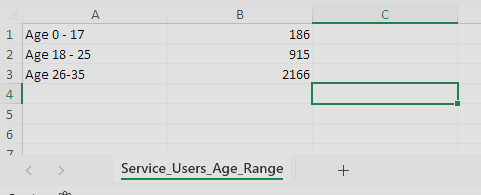
Excel Desired 

However, when I use the Excel writer with these settings
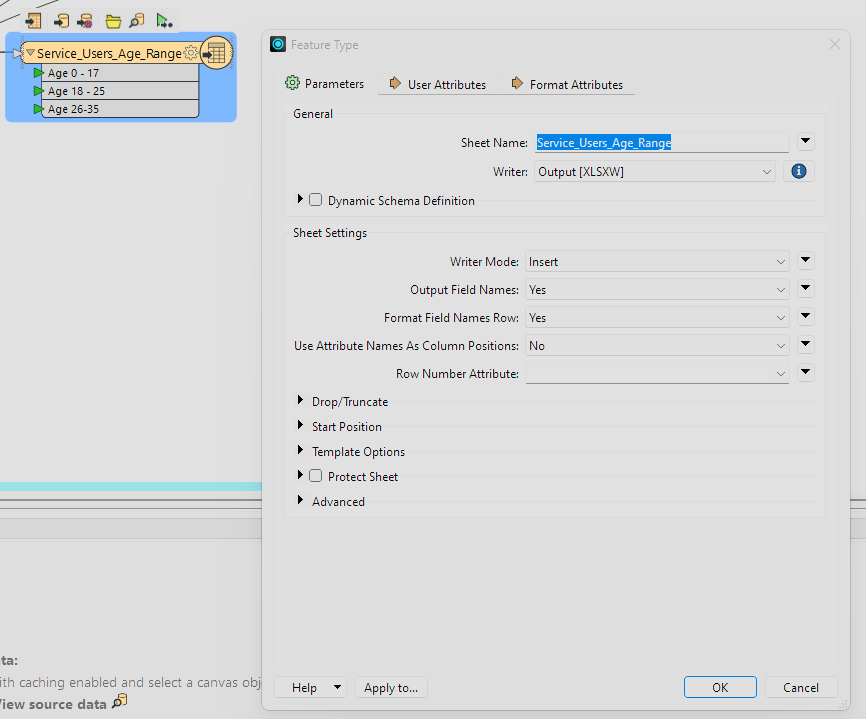
Excel WriterI get this result, I've highlighted yellow where I have gaps that I don't like, and I can only get the age groups to appear as column headings.
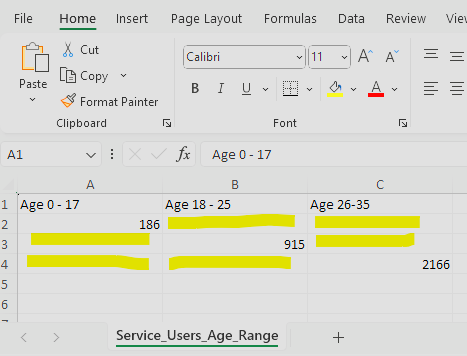
Excel resultWhat do I need to do to obtain the desired output?

Many thanks for any help you can give.

Regards

Stu

Hello @stuarmitagehome​ 

It looks like you want to transpose the output from the StatisticsCalculators/AttributeManagers. You can do this by adding an AttributeExploder similar to the second example in this transposing tutorial. You can find a demonstration of this workflow (method 1) in the workspace attached to this post.

I also want to mention the AttributeRangeMapper transformer. You should be able to use one instance of this transformer along with a StatisticsCalculator to replace the individual StatisticsCalculator and AttributeManager for each age category streams. Using one AttributeRangeMapper will reduce the number of transformers and simplify the workspace. This is marked as method 2 in the attached workspace.

Both should output the same results in the output Excel file. I hope this information helps!

Fabulous! Thank you so much. Every day is a school day, and this has really helped me to make things more efficient.


Reply