Solved

Create raster of counted polylines

  • March 27, 2023
  • 5 replies
  • 38 views

katericondo
Contributor
Forum|alt.badge.img+8

Is there a way to create a raster of polylines, showing the counts rather than density per area magnitude? I have 17,000 lines and I'm trying to recreate the below graphic/visualization:


Best answer by daveatsafe

Thanks for the dataset - I was able to tweak the workspace a bit for a proper result:

  • Added a Counter to use with the Group By on the NumericRasterizer - this will properly create a single raster for each line
  • Added a Bufferer to buffer the lines into polygons for better raster rendering - width is pixel size * 5

If you just want the raw count, you can use the output of the RasterMosaicker and discard the downstream transformers

This post is closed to further activity.
It may be an old question, an answered question, an implemented idea, or a notification-only post.
Please check post dates before relying on any information in a question or answer.
For follow-up or related questions, please post a new question or idea.
If there is a genuine update to be made, please contact us and request that the post is reopened.

5 replies

daveatsafe
Safer
Forum|alt.badge.img+19
  • Safer
  • 1637 replies
  • March 27, 2023

Hi @katericondo​,

You could create a simple raster from each line, with the line value being 1 and background being 0, then sum them with a RasterMosaicker:

Screen Shot 2023-03-27 at 3.19.19 PM
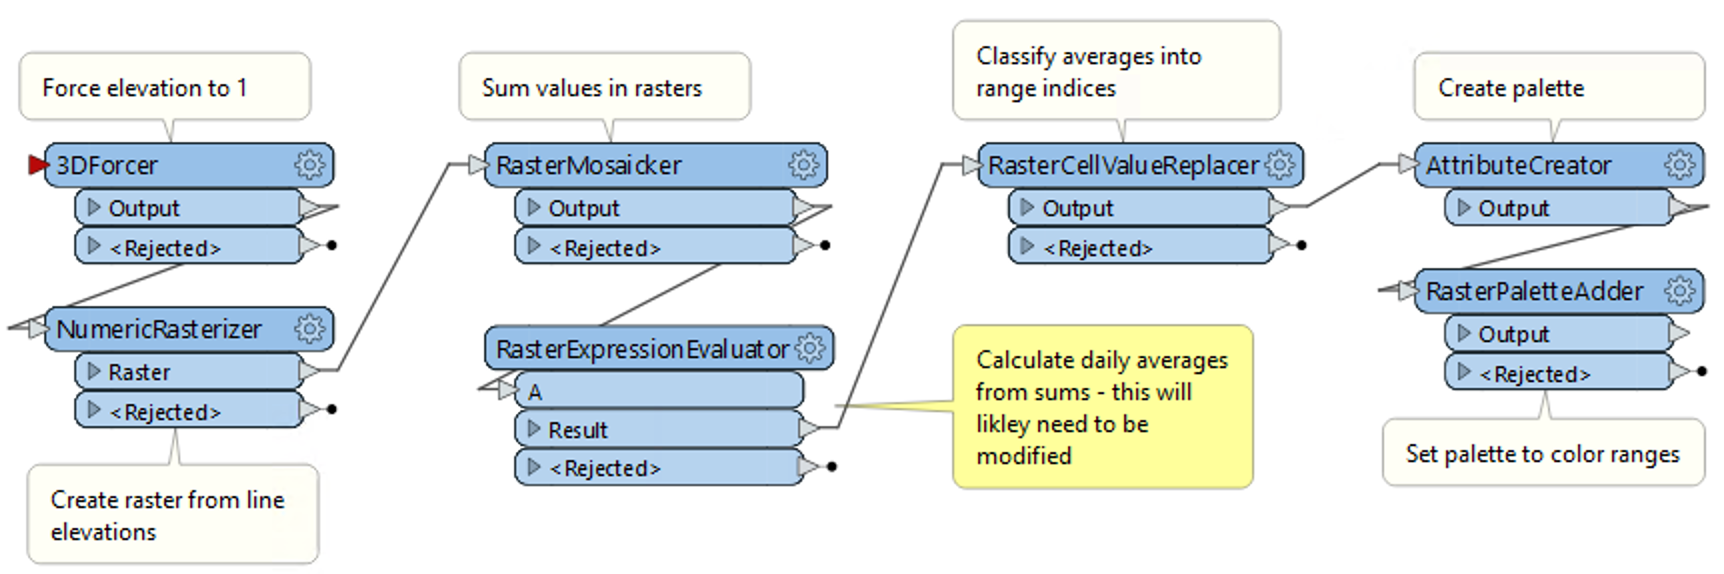
After summing the lines in a single raster, use the RasterExpressionEvaluator to calculate the daily average from the sum and the number of days. To apply a color ramp, use a RasterCellValueReplacer to assign an index to each range, then apply a color palette to the range values.

The attached workspace will do most of this for you, but you will need to adjust the calculation in the RasterExpressionEvaluator to match your date range.

The extents and resolution of the input rasterizer is published to User Parameters, allowing you to easily set the range and resolution of the final graphic. It can be just a small area of the flight lines if desired.


katericondo
Contributor
Forum|alt.badge.img+8
  • Author
  • Contributor
  • 10 replies
  • March 28, 2023

Hi @daveatsafe​ 


I'm still running into errors. Essentially, I just want number of lines (count) by raster. I created a grid and was trying to use LineOnAreaOverlayer but that's not working either. Attached is the subset I'm testing with.


katericondo
Contributor
Forum|alt.badge.img+8
  • Author
  • Contributor
  • 10 replies
  • March 28, 2023

Perhaps, using SpatialRelator, and creating a grid using the cell dimensions?


daveatsafe
Safer
Forum|alt.badge.img+19
  • Safer
  • 1637 replies
  • Best Answer
  • March 28, 2023

Thanks for the dataset - I was able to tweak the workspace a bit for a proper result:

  • Added a Counter to use with the Group By on the NumericRasterizer - this will properly create a single raster for each line
  • Added a Bufferer to buffer the lines into polygons for better raster rendering - width is pixel size * 5

If you just want the raw count, you can use the output of the RasterMosaicker and discard the downstream transformers


katericondo
Contributor
Forum|alt.badge.img+8
  • Author
  • Contributor
  • 10 replies
  • March 28, 2023

Thanks for the dataset - I was able to tweak the workspace a bit for a proper result:

  • Added a Counter to use with the Group By on the NumericRasterizer - this will properly create a single raster for each line
  • Added a Bufferer to buffer the lines into polygons for better raster rendering - width is pixel size * 5

If you just want the raw count, you can use the output of the RasterMosaicker and discard the downstream transformers

Thank you, Dave!


I just had to update Ground extents to use input for it to run with our larger dataset, and wrote to an Esri raster.


All the best!