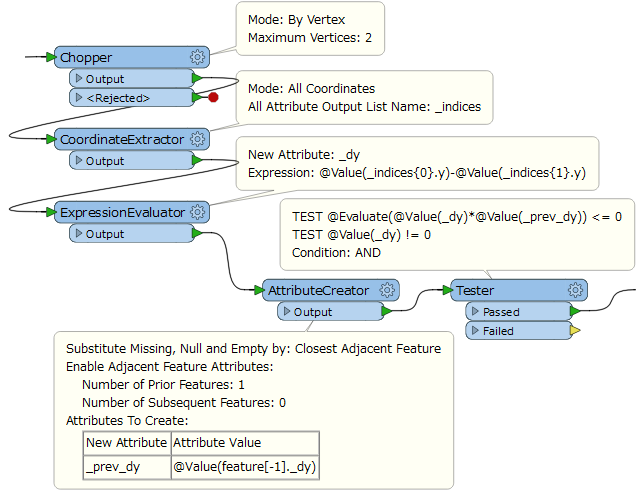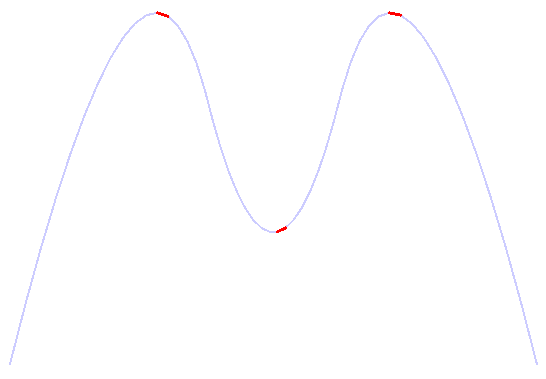
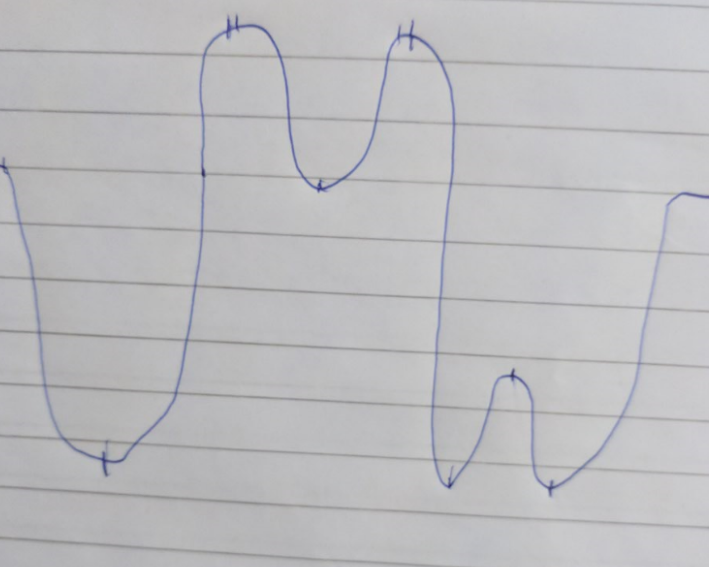
I need to find the top/bottom turningpoint of a dataset - as seen on the image below. these are expressed as x,y,z and possible more attributes. Is there another way than python?


 +25
+25I need to find the top/bottom turningpoint of a dataset - as seen on the image below. these are expressed as x,y,z and possible more attributes. Is there another way than python?
No account yet? Create an account
Enter your E-mail address. We'll send you an e-mail with instructions to reset your password.