Question

how to generate histogram


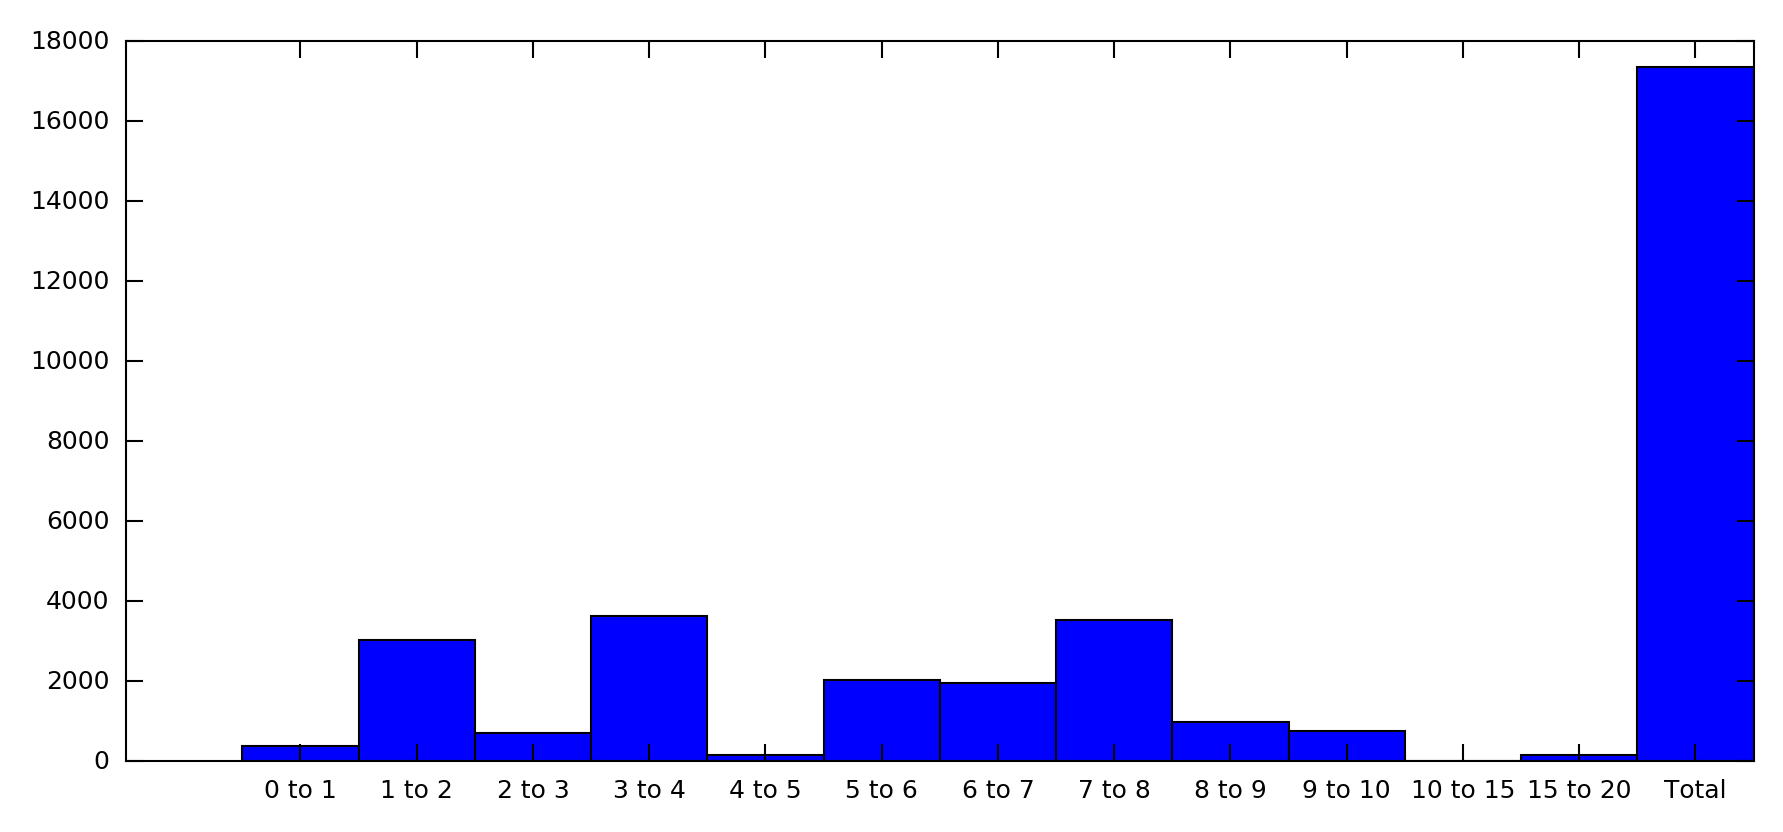
Pl. see data in attached Excel file. I am able to obtain the data ready to plot histogram as shown in the attached Excel file. The further steps to plot histogram is where I am stuck.

8 replies

danilo_fme
Evangelist
Forum|alt.badge.img+45
  • Evangelist
  • August 20, 2017

Hi @bey_atkins2009,

The transformer ChartGenerator is interessant in your case.

You can find the documentation Chart Generator.

Thanks,

Danilo


fmelizard
Safer
Forum|alt.badge.img+19
  • Safer
  • August 22, 2017
Hi @bey_atkins2009, are you wanting a graphical histogram or a summary table like you've shown in your Excel? Also, what format do you want to write the histogram to?

mygis
Supporter
Forum|alt.badge.img+14
  • Supporter
  • August 23, 2017

Hello @bey_atkins2009,

In addition to @danilo_inovacao good recomendation you can use the HTMLreportGenerator to generate and display your charts in an HTML page using FME Desktop.

Cheers.

Lyes


fmelizard wrote:
Hi @bey_atkins2009, are you wanting a graphical histogram or a summary table like you've shown in your Excel? Also, what format do you want to write the histogram to?
Hi TiaAtSafe, I am already able to generate the summary table that I have shown. I would like to generate a graphical histogram from that summary table data and save it as an image file (.png). Is it a problem that the X values are not numeric values in this case ?


danilo_fme
Evangelist
Forum|alt.badge.img+45
  • Evangelist
  • August 23, 2017

Hi @bey_atkins2009, could you share us your Workspace template ( . fmwt ) ?

Thanks,

Danilo


danilo_fme wrote:

Hi @bey_atkins2009, could you share us your Workspace template ( . fmwt ) ?

Thanks,

Danilo

Pl. find the data in .csv file and the FME file .fmw in the attached zip file


test.zip


fmelizard
Safer
Forum|alt.badge.img+19
  • Safer
  • August 23, 2017

Hi @bey_atkins2009, using the ChartGenerator like @danilo_inovacao suggested should give you the output you're after. I created the following using the transformer:

I set the Chart Type to Bar in order to label with your range values.


EDIT: The Data Attribute was set to Number and the Data Label Attribute to Range.


danilo_fme
Evangelist
Forum|alt.badge.img+45
  • Evangelist
  • August 23, 2017
fmelizard wrote:

Hi @bey_atkins2009, using the ChartGenerator like @danilo_inovacao suggested should give you the output you're after. I created the following using the transformer:

I set the Chart Type to Bar in order to label with your range values.


EDIT: The Data Attribute was set to Number and the Data Label Attribute to Range.

Perfect @TiaAtSafe, good Job.


Reply


Cookie policy

We use cookies to enhance and personalize your experience. If you accept you agree to our full cookie policy. Learn more about our cookies.

 
Cookie settings