
Question of the Week: Show us a photo of a real world FME project


This is week two of the August photo contest in the FME Community! If you missed week one, find it here.

Congratulations to our randomly selected week one winners @jenniferadhall and @maddiegiles! You’ve each won a $25 Amazon gift card.

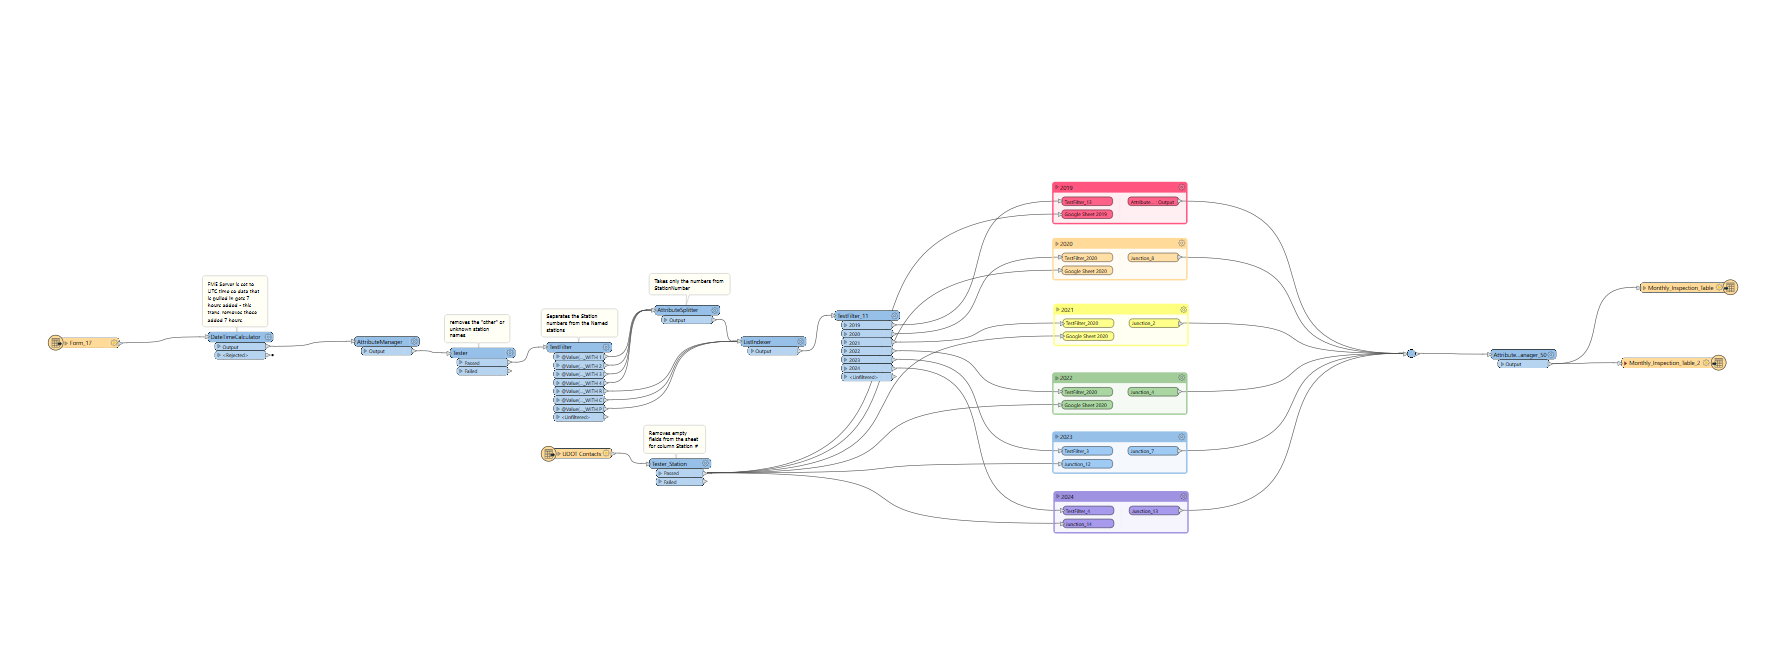
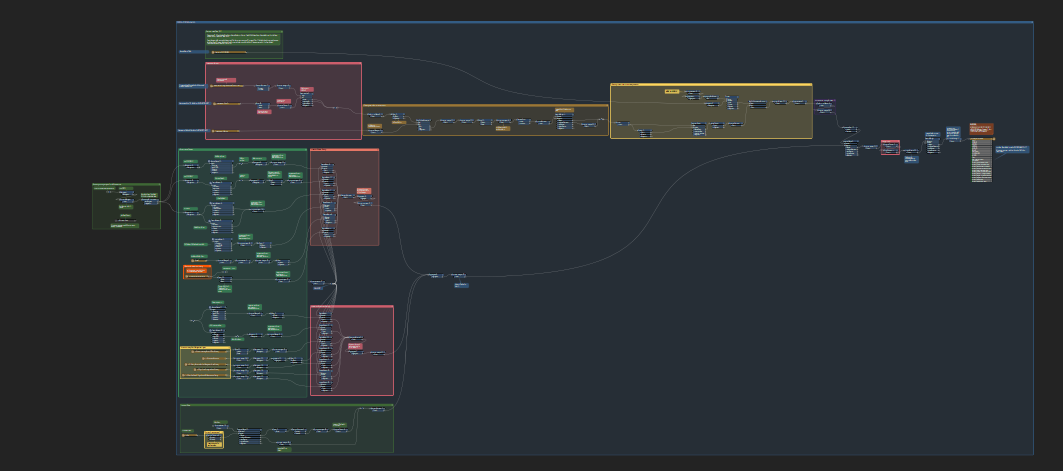
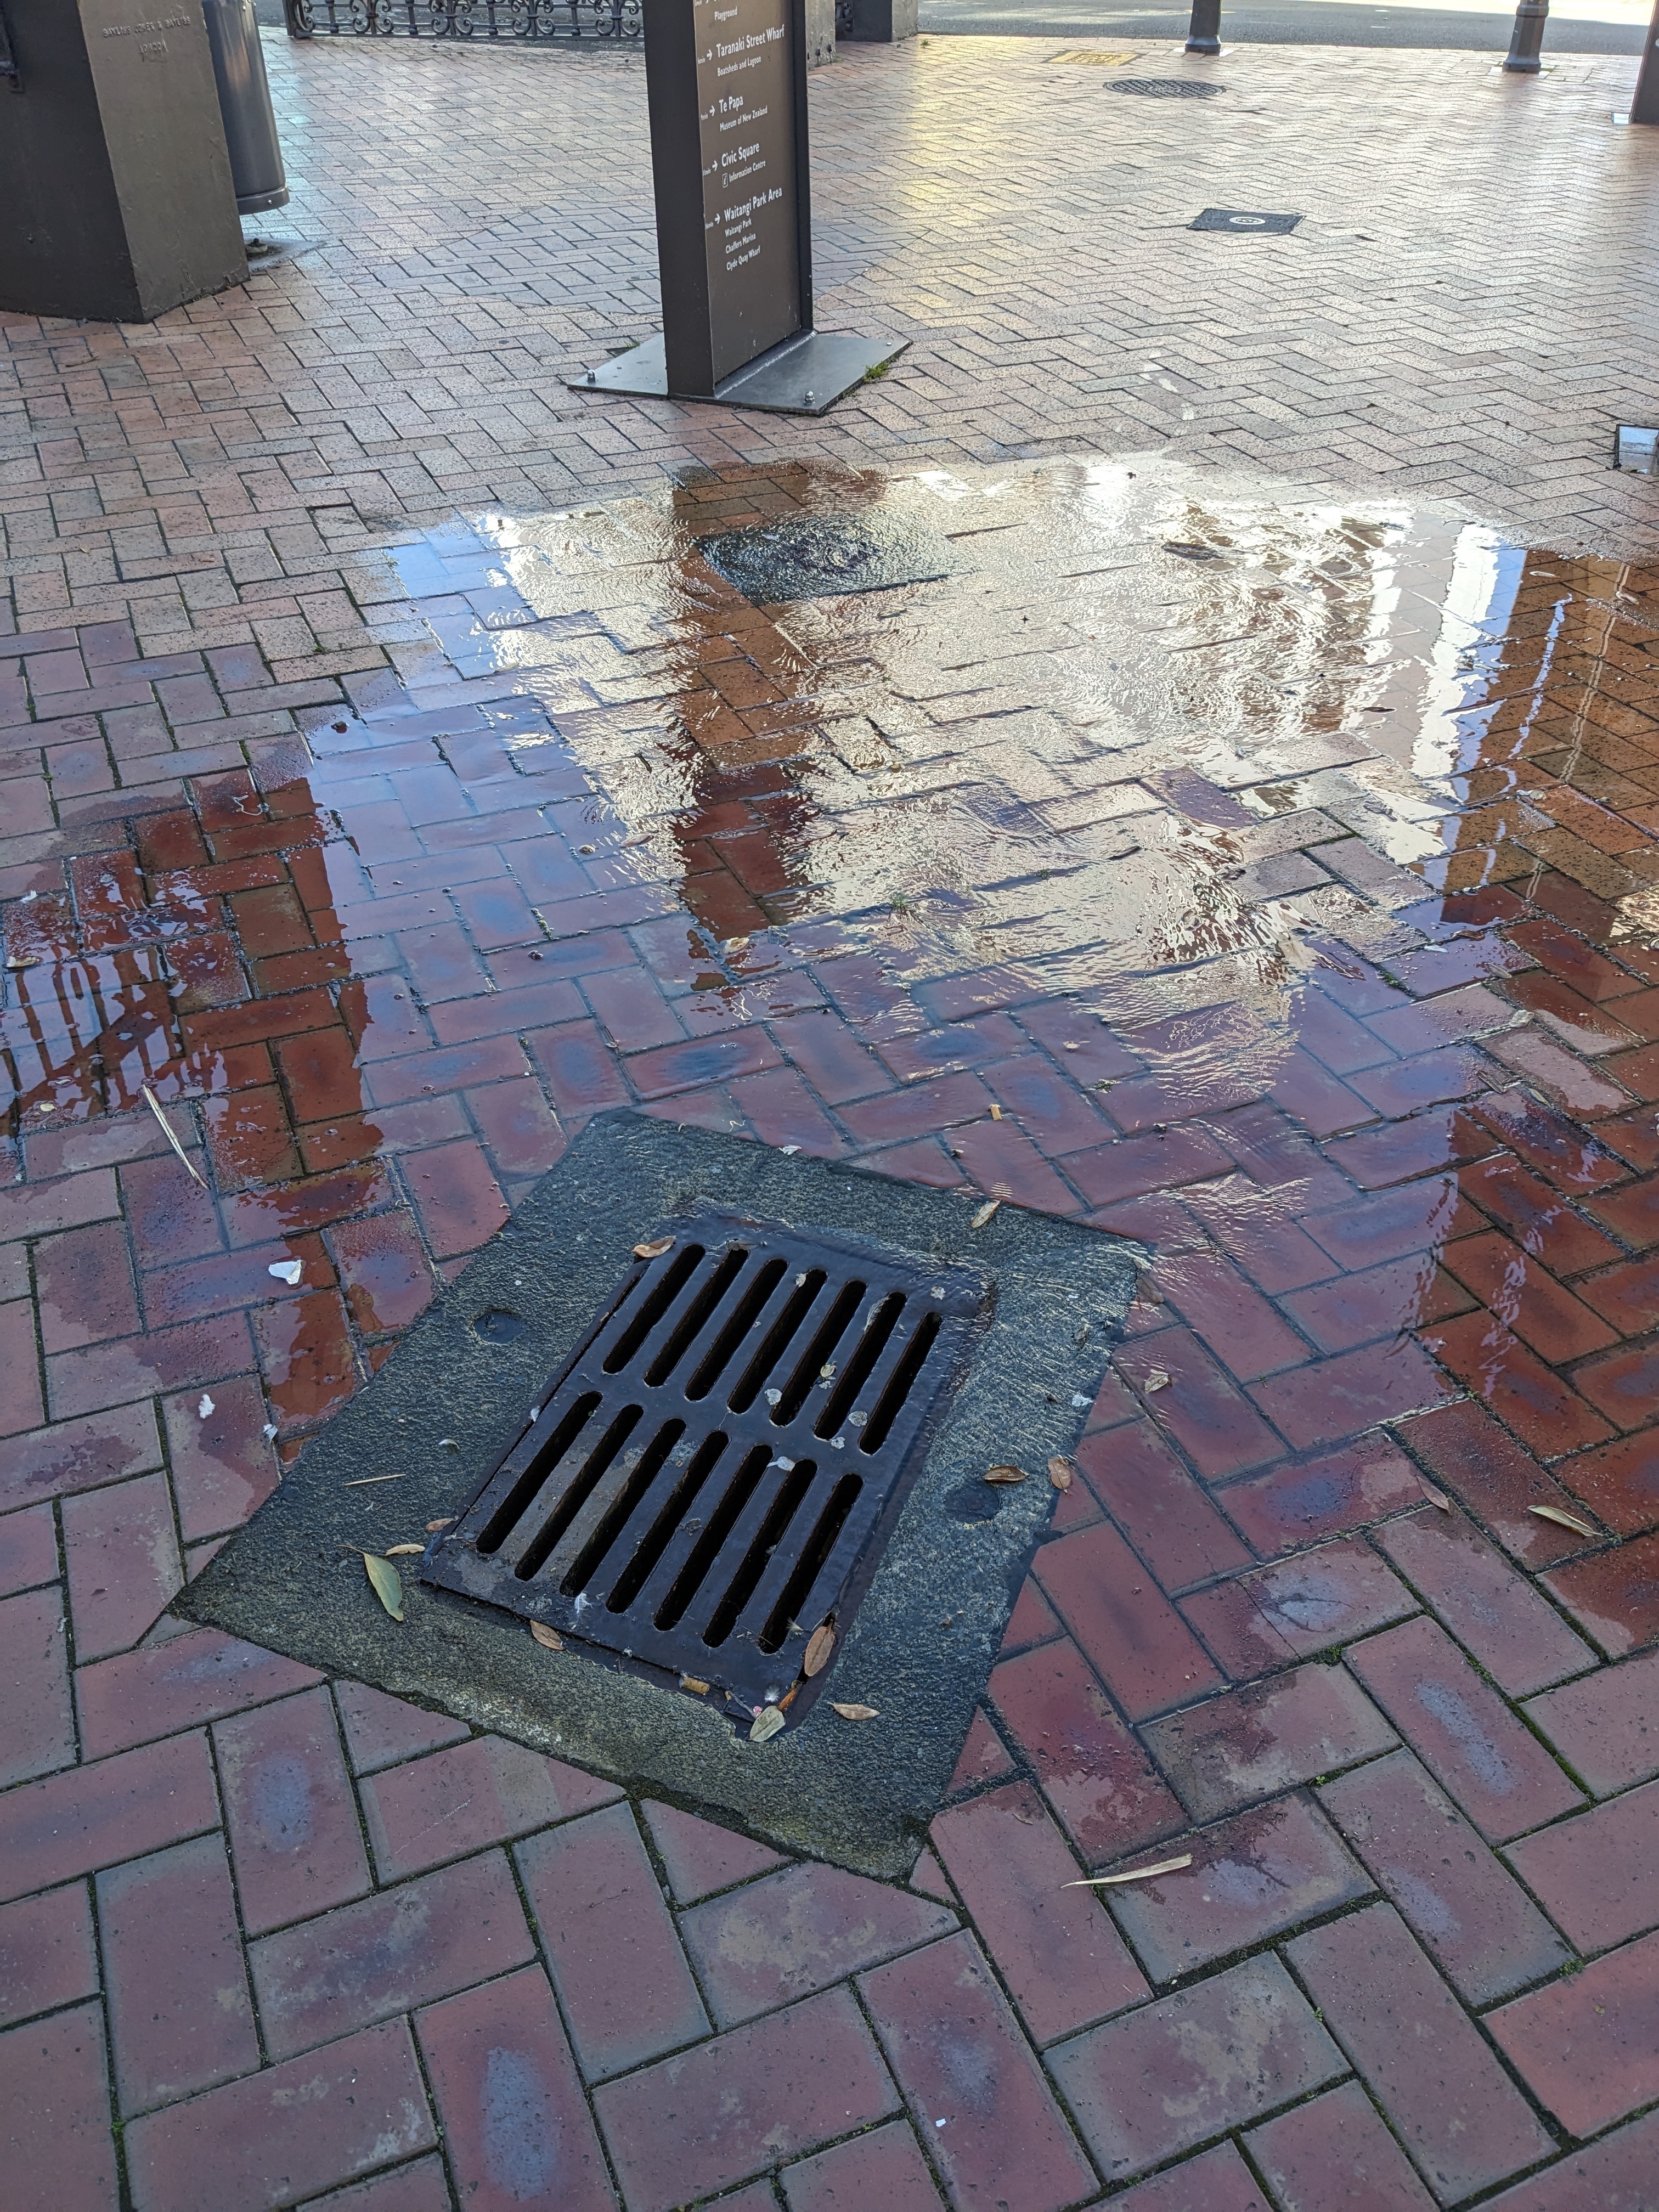
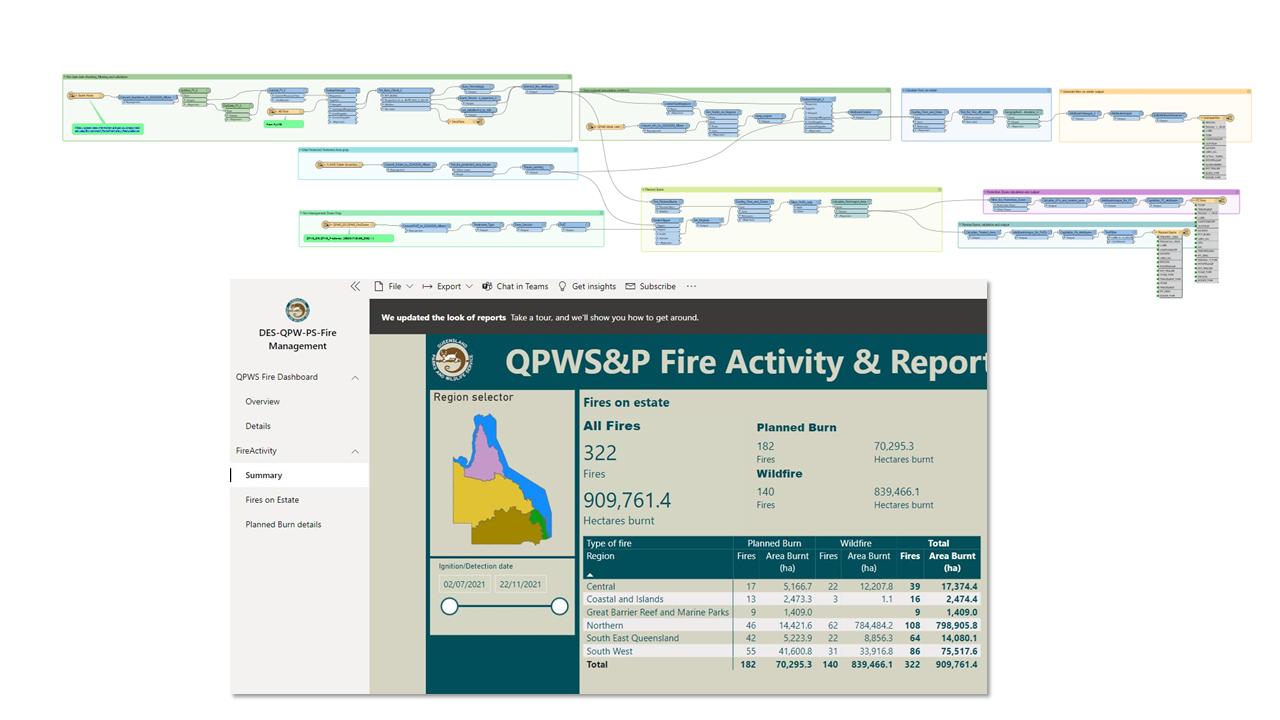
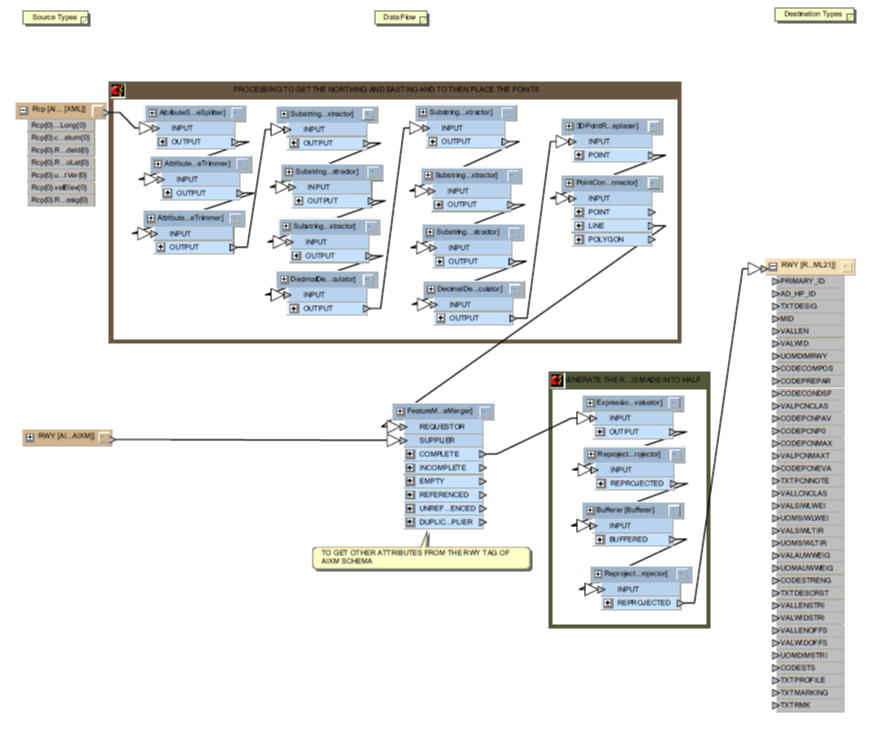
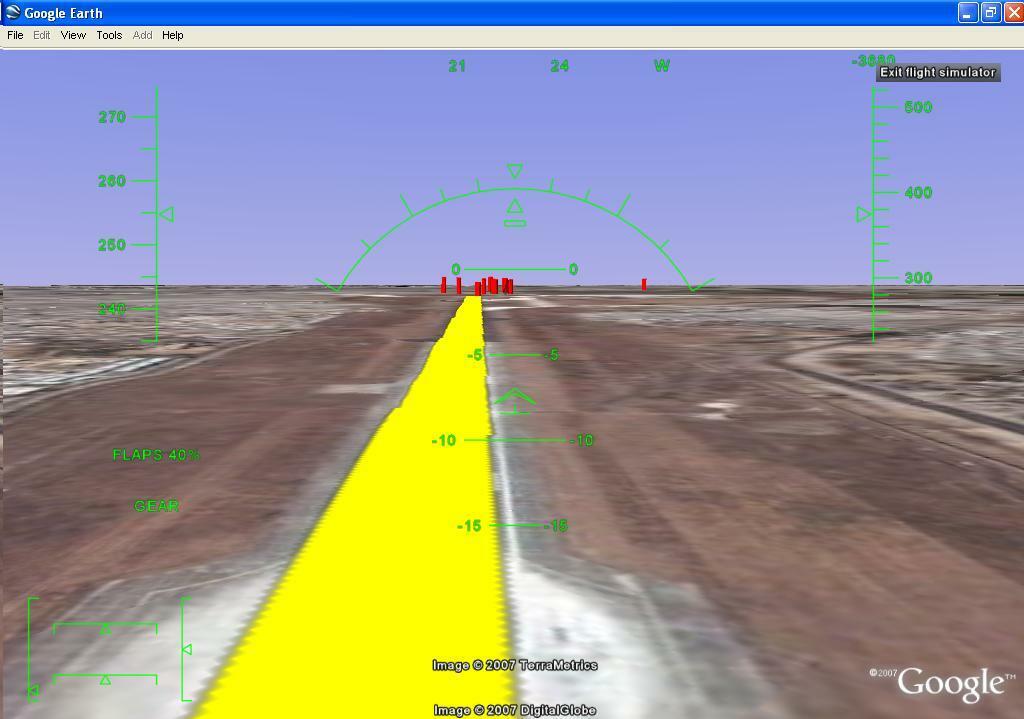
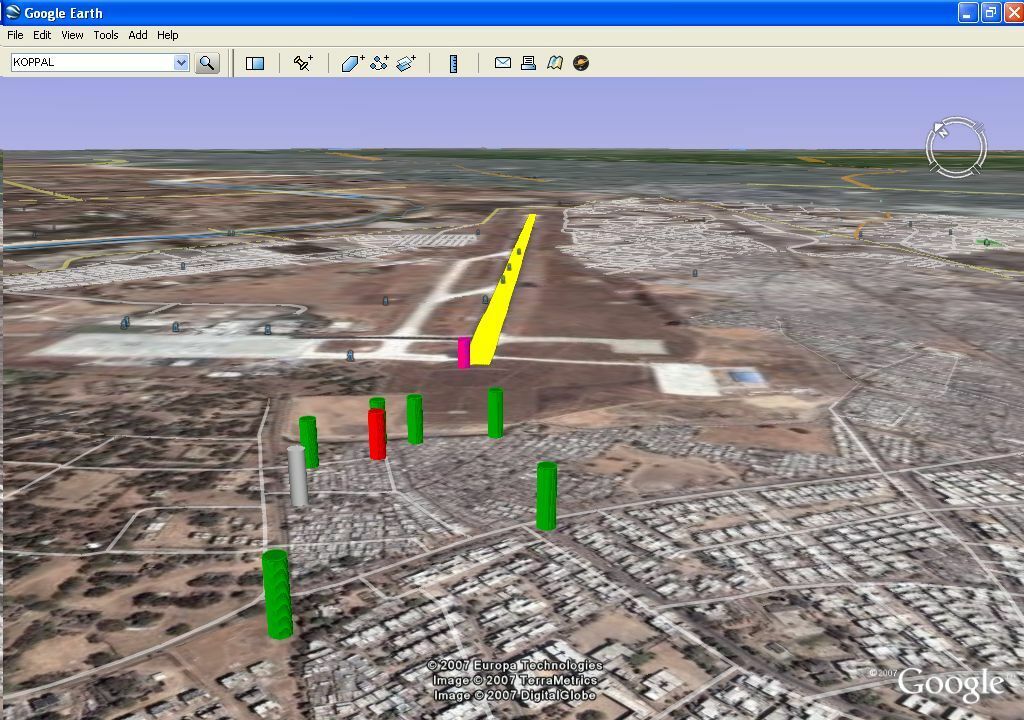
This week’s challenge: show us a photo of a real world project in which FME has played a part or had an impact. Post it in the comments below.

How the Contest Works

Each Tuesday in August, our Question of the Week will be themed around photography - from sharing a photo of your workspace view to capturing your furry friends with Safe swag! 

Answer the weekly question and share a photo in our Question of the Week Forum. Each question you answer with a photo earns you an entry for that week’s prize draw and our grand prizes!

What You Can Win: 

  • Weekly wins: Two lucky winners will be randomly chosen each week (8 total) to win a $25 Amazon gift card 
  • Community Choice: The photo with the most upvotes at the contest’s end will snag a DJI Action Camera ($300 USD value)
  • Safe Software’s Choice: Our Safer judging panel will pick their favourite photo to win another DJI Action Camera ($300 USD value)

Contest Guidelines

The contest runs from August 6 to August 30, 2024. You must be a registered user in the community to participate. Find the full contest guidelines here.

workspace to calculate land use and sewer connectivity status. ArcGIS parcel feature service as base, joined with tax info (CSV), buildings (CSV). then spatial joined and neighbor finder with existing sewer infrastructures (fGDB)


‘Real’ world in the life of a Safer prepping for next week’s API webinar 😎


My largest FME process that keeps track of Maintenance Stations completing monthly SWPPP surveys


FME workbench with ~20 different inputs to assess wastewater pipe criticality to prioritize renewals
Leaky water pipe in Wellington CBD draining directly into Stormwater drain

I love my city, but oh my goodness it has some issues with leaky pipes.

Chronic underinvestment x earthquakes = very big problem.

We designed multiple FME workbenches to assess the condition, criticality and constructability of wastewater and potable water pipes to help clients better prioritize renewal options. It’s satisfying to know that data driven decisions through FME have a direct impact on fixing our leaky pipes.  


My largest FME process that keeps track of Maintenance Stations completing monthly SWPPP surveys

I love that every workspace looks like a piece of art! 😍 


This is from a few years ago, when I first experienced how FME could make my data wrangling activities manageable and even enjoyable. I was working for the Queensland Parks and Wildlife Service at the time in the role of spatial fire support. One of my responsibilities was to prepare data to report on fire management KPI’s around hazard reduction (planned) burns across fire management zones in protected areas. This was originally done with exported shapefiles, python and a complicated excel spreadsheet. FME streamlined the process and while excel was still the endpoint it was more of a parking bay for the finished data so it could be pulled into a Power BI dashboard.

And here’s me on an actual hazard reduction burn.


‘Real’ world in the life of a Safer prepping for next week’s API webinar 😎


Love the behind the scenes! 


FME workbench with ~20 different inputs to assess wastewater pipe criticality to prioritize renewals
Leaky water pipe in Wellington CBD draining directly into Stormwater drain

I love my city, but oh my goodness it has some issues with leaky pipes.

Chronic underinvestment x earthquakes = very big problem.

We designed multiple FME workbenches to assess the condition, criticality and constructability of wastewater and potable water pipes to help clients better prioritize renewal options. It’s satisfying to know that data driven decisions through FME have a direct impact on fixing our leaky pipes.  

Very cool to see the direct impact on your city! 💦


This is from a few years ago, when I first experienced how FME could make my data wrangling activities manageable and even enjoyable. I was working for the Queensland Parks and Wildlife Service at the time in the role of spatial fire support. One of my responsibilities was to prepare data to report on fire management KPI’s around hazard reduction (planned) burns across fire management zones in protected areas. This was originally done with exported shapefiles, python and a complicated excel spreadsheet. FME streamlined the process and while excel was still the endpoint it was more of a parking bay for the finished data so it could be pulled into a Power BI dashboard.

And here’s me on an actual hazard reduction burn.


Wow, thank you for sharing!


This real world FME project dates back to 2007 and pertains to aviation and public safety.

Being from a country sensitive to map data, satellite imageries, aerial photographs and other similar data FME has always helped me over these years (ever since the KML writer was first introduced in FME) to teleport myself like the characters in the popular American science fiction entertainment series Star Trek to places not only in India but across the globe. The KML diagrammer and other transformers were my transporter device.

Here is an interesting application of a bunch of FME transformers on an AIXM dataset that was carried out by SRG (that’s me) from PIXEL SOFTEK for a customer in the aerospace industry as an exercise to showcase the power of FME, basically a Proof-of-Concept. For the sales team at Safe Software following this thread, this PoC led to a FME license sale.

When reading AIXM, FME will interpret the XML document and, wherever possible, create an appropriate geometry for features. However, relationships between AIXM entities are complex. In most cases a FME workspace has to be configured to join several features together to form complete AIXM features. In this benchmarking the challenge were two things. One to generate the runway as a polygon element even though the RWY XML tag in the AIXM file had no geometry property set and it was required to extract the length and width from the XML user attributes in other related features. The second challenge was to symbolize the obstacles on the ground for take off and landing which did not have a xml_geom value set in the AIXM file to extruded 3d objects for visualization in Google Earth.

Leave alone the custom transformers, thanks to the myriad of ready to use transformers in FME, the run way generation was possible with a combination of FME transformers like SubstringExtractor (to get the data to required format as the attributes were in #######.#E, #######.#N format), DecimalDegreesCalculator to get to plot the points for the runway start and end with a 3DPointReplacer, PointConnector and finally a Bufferer to get the runway polygon. The most interesting part of this benchmark was the second challenge to symbolize the obstacles on the ground for take off and landing from the obstacles tag of AIXM file and to extrude them as 3d objects for visualization in Google Earth.

This is where the KMLDiagrammer a custom transformer from @dmitribagh of Safe Software came handy. KMLDiagrammer allows building 3D diagrams for Google Earth according to values in the supplied attribute. In this case the based on the elevation attribute the obstacle was extruded into 3d objects to get a visual effect of the obstacle during flight simulation in Google Earth. KMLStyler was additionally used to set appropriate symbols from the custom icon library created based on the type of objects. For example trees were symbolized with an appropriate icon file created in png format. Yes, FME and the transformers did teleport me in Google Earth right into the middle of the runway.

Would you to like to Jet…Set and Go like me, then use FME as much as you can!

Happy FME-ing :-)

SRG

Here are some snapshots of the real world FME project.


Runway Generator FME Workspace


KMLDiagrammer FME Workspace to generate the obstacles in the flight path

Some pictures of the output KML generated from AIXM using FME.


This real world FME project dates back to 2007 and pertains to aviation and public safety.

Being from a country sensitive to map data, satellite imageries, aerial photographs and other similar data FME has always helped me over these years (ever since the KML writer was first introduced in FME) to teleport myself like the characters in the popular American science fiction entertainment series Star Trek to places not only in India but across the globe. The KML diagrammer and other transformers were my transporter device.

Here is an interesting application of a bunch of FME transformers on an AIXM dataset that was carried out by SRG (that’s me) from PIXEL SOFTEK for a customer in the aerospace industry as an exercise to showcase the power of FME, basically a Proof-of-Concept. For the sales team at Safe Software following this thread, this PoC led to a FME license sale.

When reading AIXM, FME will interpret the XML document and, wherever possible, create an appropriate geometry for features. However, relationships between AIXM entities are complex. In most cases a FME workspace has to be configured to join several features together to form complete AIXM features. In this benchmarking the challenge were two things. One to generate the runway as a polygon element even though the RWY XML tag in the AIXM file had no geometry property set and it was required to extract the length and width from the XML user attributes in other related features. The second challenge was to symbolize the obstacles on the ground for take off and landing which did not have a xml_geom value set in the AIXM file to extruded 3d objects for visualization in Google Earth.

Leave alone the custom transformers, thanks to the myriad of ready to use transformers in FME, the run way generation was possible with a combination of FME transformers like SubstringExtractor (to get the data to required format as the attributes were in #######.#E, #######.#N format), DecimalDegreesCalculator to get to plot the points for the runway start and end with a 3DPointReplacer, PointConnector and finally a Bufferer to get the runway polygon. The most interesting part of this benchmark was the second challenge to symbolize the obstacles on the ground for take off and landing from the obstacles tag of AIXM file and to extrude them as 3d objects for visualization in Google Earth.

This is where the KMLDiagrammer a custom transformer from @dmitribagh of Safe Software came handy. KMLDiagrammer allows building 3D diagrams for Google Earth according to values in the supplied attribute. In this case the based on the elevation attribute the obstacle was extruded into 3d objects to get a visual effect of the obstacle during flight simulation in Google Earth. KMLStyler was additionally used to set appropriate symbols from the custom icon library created based on the type of objects. For example trees were symbolized with an appropriate icon file created in png format. Yes, FME and the transformers did teleport me in Google Earth right into the middle of the runway.

Would you to like to Jet…Set and Go like me, then use FME as much as you can!

Happy FME-ing :-)

SRG

Here are some snapshots of the real world FME project.


Runway Generator FME Workspace


KMLDiagrammer FME Workspace to generate the obstacles in the flight path

Some pictures of the output KML generated from AIXM using FME.


Teleportation! 😧 Thank you for sharing. Love the Google Earth shots! I’m going to have to share this with the sales team 😆


This workspace played a fundamental role in the mining sector.

Initially, we calculated and identified possible areas to drill mining holes.

We avoided some environmental disasters with this workspace.


FME saves Life! :)


Last chance to get your photo entries in for week two before week three is posted tomorrow! 


Reply