Lets say I have locations of point/polygon features along a line and I would like to count the number of points along the line using a moving window. For instance I'd like to slide along the line using a window of 100 feet.


As I move along the line, I want a count the number of points within the 100 feet window until I reach the end.

Once the counts is done, I'd like to segment the line as well, based on the total counts within the 100 feet window.


Any ideas and help on this will be greatly appreciated.

First thoughts, use a measureGenerator on the line, then a PointOnLineOverlayer with Merge Measures set to Yes and Treat Measures as Continuous.


The points now all have a measure storing their distance along the line. Use a MeasureExtractor to store that value as an attribute.


Use a ListBuilder to get a feature containing all the point distances in a list. You can use that list to do your moving window analysis. I would probably drop into python to do this, but you could probably figure out something using the ListSearcher in First Greater Than mode to get the index as a proxy for the count.


Check out my answer to this question here: https://community.safe.com/s/question/0D54Q00008EeSH9SAN/question-of-the-week-lists-measures-and-spatial-analysis-without-the-spatial


First thoughts, use a measureGenerator on the line, then a PointOnLineOverlayer with Merge Measures set to Yes and Treat Measures as Continuous.


The points now all have a measure storing their distance along the line. Use a MeasureExtractor to store that value as an attribute.


Use a ListBuilder to get a feature containing all the point distances in a list. You can use that list to do your moving window analysis. I would probably drop into python to do this, but you could probably figure out something using the ListSearcher in First Greater Than mode to get the index as a proxy for the count.

I made a question-of-the-week answer to this post... and the results are eerily similar to yours (measures, lists, ListSearcher, etc). Definitely a case of great minds thinking alike. Check out the link to see what I did: https://community.safe.com/s/question/0D54Q00008EeSH9SAN/question-of-the-week-lists-measures-and-spatial-analysis-without-the-spatial


I made a question-of-the-week answer to this post... and the results are eerily similar to yours (measures, lists, ListSearcher, etc). Definitely a case of great minds thinking alike. Check out the link to see what I did: https://community.safe.com/s/question/0D54Q00008EeSH9SAN/question-of-the-week-lists-measures-and-spatial-analysis-without-the-spatial

Does it make it better or worse that I answered that question on 3 hours of sleep and no caffeine?


Though I admit that's why I got to the point of ListSearcher and went do something with it.


The main difference between your initial portion and mine, is that you interpreted the question to mean vertices along the line (which is how I originally read the question) whereas I reread the question to mean there was a secondary dataset of points (and polygons) of interest, and they were what needed to be counted.


Either way, the important thing is getting them as a list of measures.


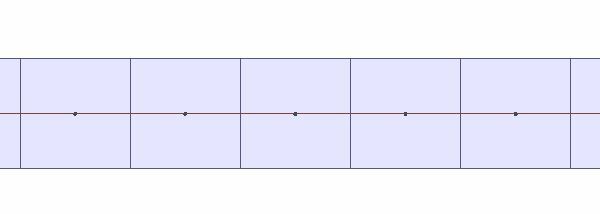
It's a pretty simple idea but the problem you face is a line with an angle. 100' horizontally or vertically will generate some nice pretty boxes but when you get to diagonal lines you will need to calculate them differently. Essentially, you have to create a dancing set of points that travel down the line at various lengths to meet the 100' box edges.


Example;

2 unit spacing between vertex with 1 unit box. Nice and pretty.

horzvertbox2 unit spacing with 1 unit box on any other line creates overlapping boxes. You need to increase the distance between vertices to make the box 100' from box to box.
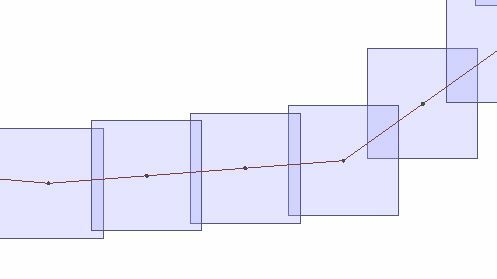
 

diagbox 

To overcome this you can loop through the segments based on their angle, extend the line, and use the end vertex as the new point of origin for creating the box.


Example

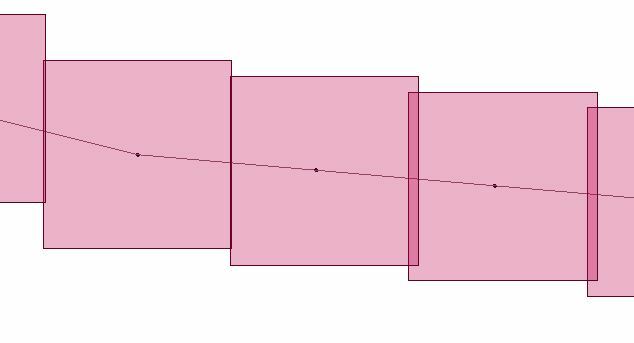
Boxes every X units on a line with angle. The angle creates overlap.

diagasisFor each angle extend the segment by X units and generate nodes (see 2 dots in the center of each box) Notice the overlap on boxes 1 and 2.
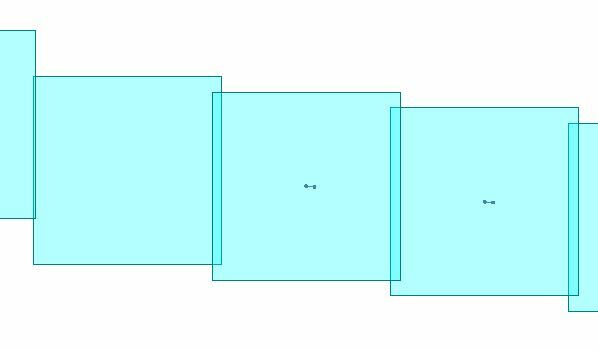
 

diagasisextendnodeUsing the new node create a new box. The gap goes away for box 1 and 2. Loop this through every feature and you will end up with a grid of evenly spaced boxes without overlap. They have to be handled one segment at a time and looped because the next box requires the previous segment joined together as a new segment for the next calculation.
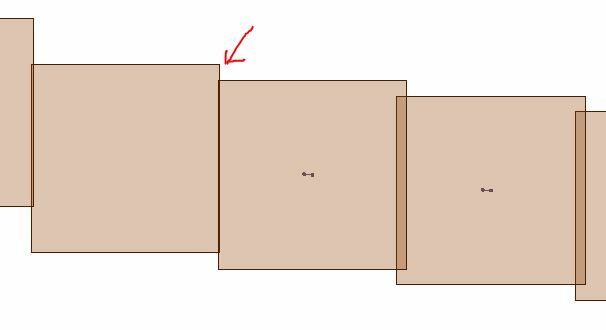
 

diagfixed 

Attached workbench. It's a bit of a mess but I hope it helps. Let me know if this doesn't make sense.


Reply