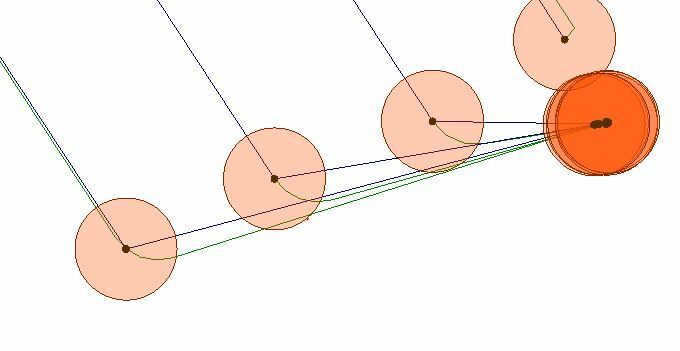
Hello @datanomad , have you considered trying to chop the line into 2 vertex pieces, measuring their angle, and then checking the adjacent pieces - if the angle is within tolerance, consider it straight, if it is very different, the curve begins! Let me know if you have any success, Kailin.
A TopologyBuilder with a value of 2 will create the nodes and lines so you can see what you are dealing with and then a length calculator and tester can be used to isolate the feature you want.
I had a try at Kailin's suggested method. It's pretty straightforward to chop the lines (Chopper), calculate the azimuth (HorizontalAngleCalculator), and then find the adjacent one (AttributeManager with adjacent attributes turned on). It's even simple enough to create an average of the previous 3 sectors.
But where I'm having problems is with angles close to 0. If one line has an azimuth of 358 and the other has an azimuth of 002, then there is only 4 degrees difference... as long as you can figure out the rollover through 360 degrees. Otherwise you get a difference of 358 degrees, which could be construed as a large turn.
So I'm working on that. Should be able to get an answer fairly soon...
Here is a sample fmwt. My goal is to cut the line where it cuvres and end up with the longest part of it without the curve part.
Hello @datanomad , have you considered trying to chop the line into 2 vertex pieces, measuring their angle, and then checking the adjacent pieces - if the angle is within tolerance, consider it straight, if it is very different, the curve begins! Let me know if you have any success, Kailin.
I tried the chopper the issue I was running into was that I could not control where it chops, I have created a sample test data for your use below.
A TopologyBuilder with a value of 2 will create the nodes and lines so you can see what you are dealing with and then a length calculator and tester can be used to isolate the feature you want.
I tried the topology builder and the geometry filter to try and catch the arcs earlier today and I could not get that to work at all. I kept getting the data I fed into it, with no other calculation or adjustments. The closest I got to anything was using the chopper as suggest by @kailinatsafe
I even tried the polylineanalyzer, and for a minute I thought I might be on to something, unfortunately I discovered the points created does not show any type of angular position in respect to the line. Unless I am not usnig it the way it is intended to be use.
I wrote this up as the Question-of-the-Week. You can find that answer (and workspace) here: https://community.safe.com/s/question/0D54Q00008FXSWRSA5/question-of-the-week-separating-straight-from-curved (and I attached my workspace here too).
I'll also check your workspace anyway. The PolylineAnalyzer (or HorizontalAngleCalculator, as I used) is definitely what you want to use.
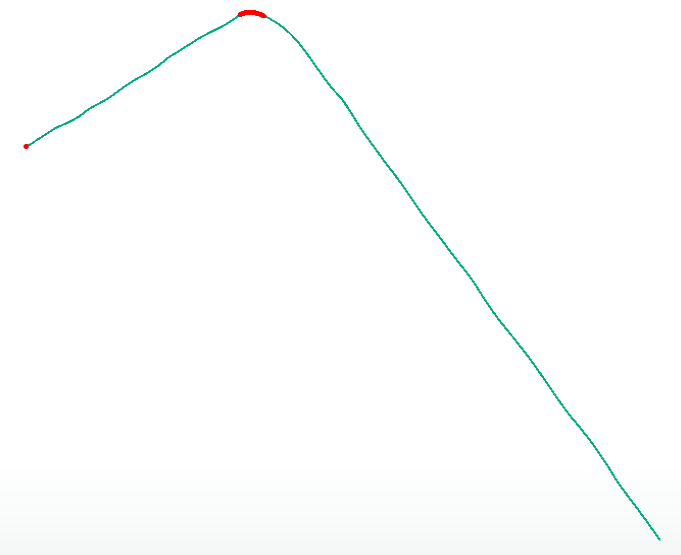
With your data in my workspace, the result looks like this:
Basically it has extracted out the corner curve. You could put the other parts back together with a LineCombiner. I don't think it can tell automatically which is the straight part to keep (ie what comes after the curve) but you could probably figure that out by the order in which the features exit the Tester.
So using your logic, how do ou drop everything from the first red dot to the second red line, theeby leaving you with just the final long green line?
Hi @datanomad ,
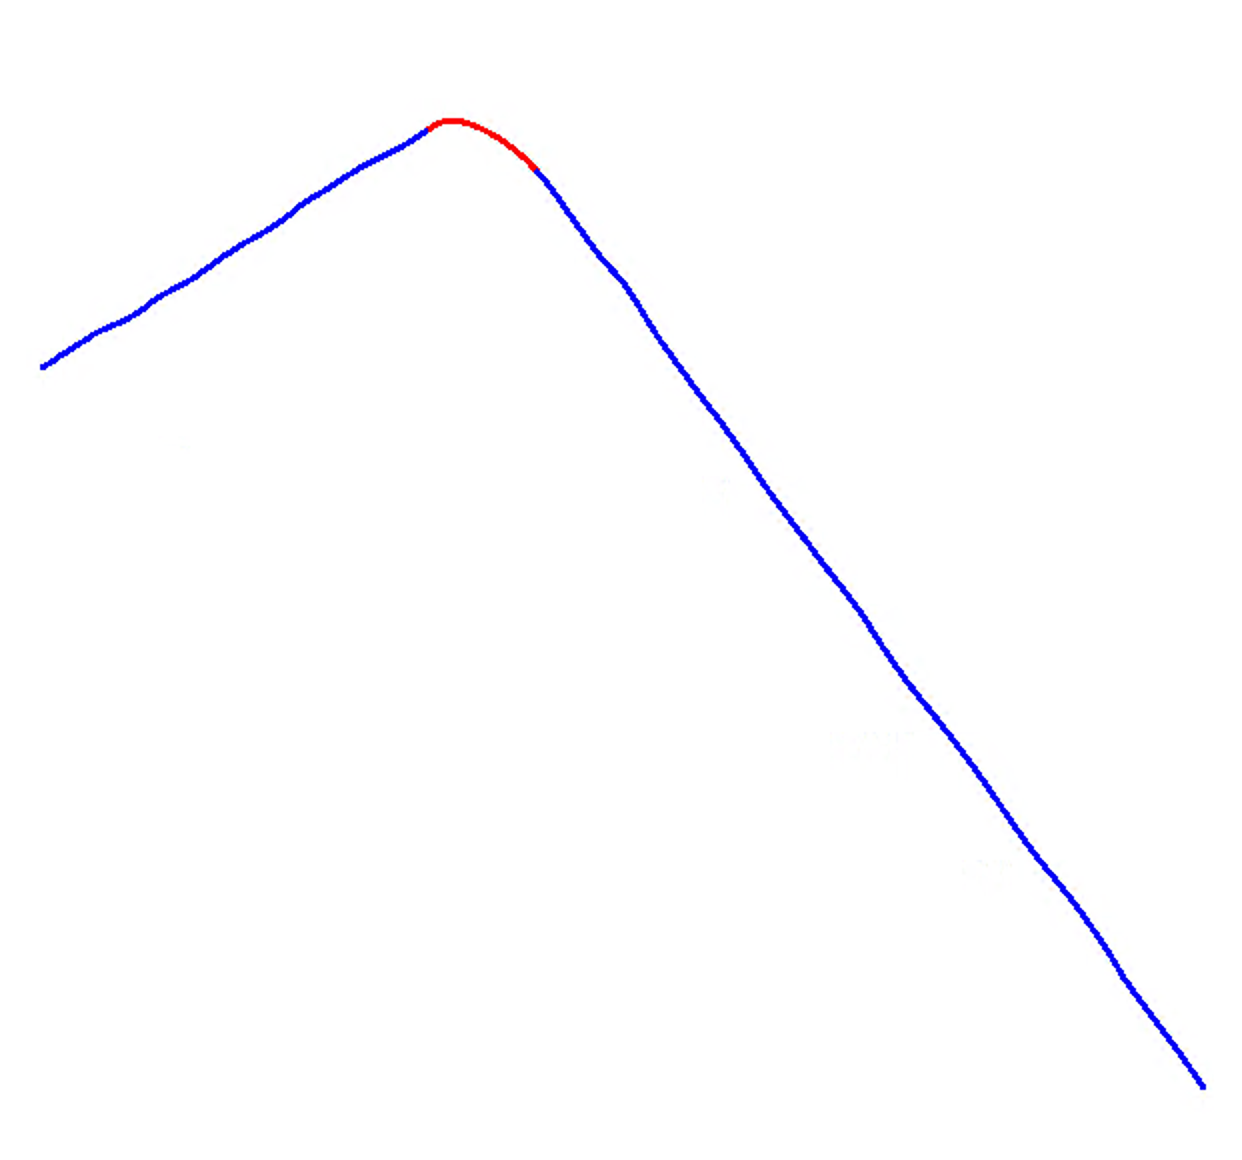
For a bit of fun, I created an alternate solution that replaces segments of the line (temporarily) with arcs, then analyzes the curvature to determine whether it is to be kept. The workspace allows you to choose how many line segments to include in the arcs, and the cutoff sweep angle.
Using 4 segments and a sweep cutoff of 20 degrees produces the resulting blue line, with red showing the removed section:As a bonus, there is no math required 😀 .
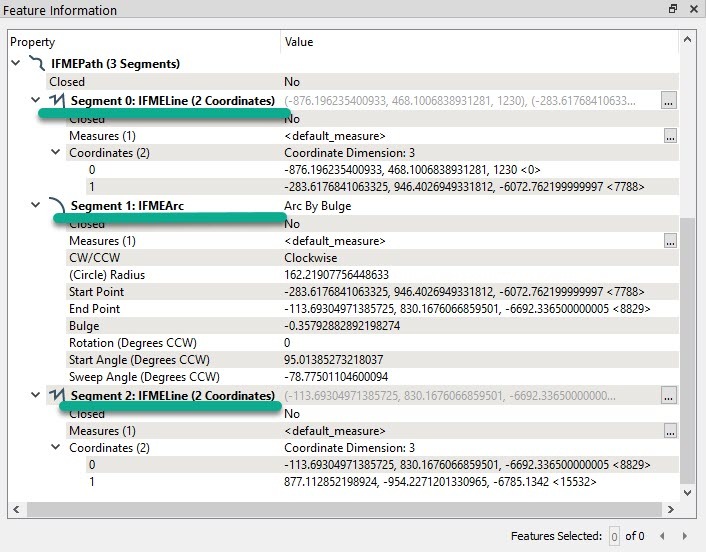
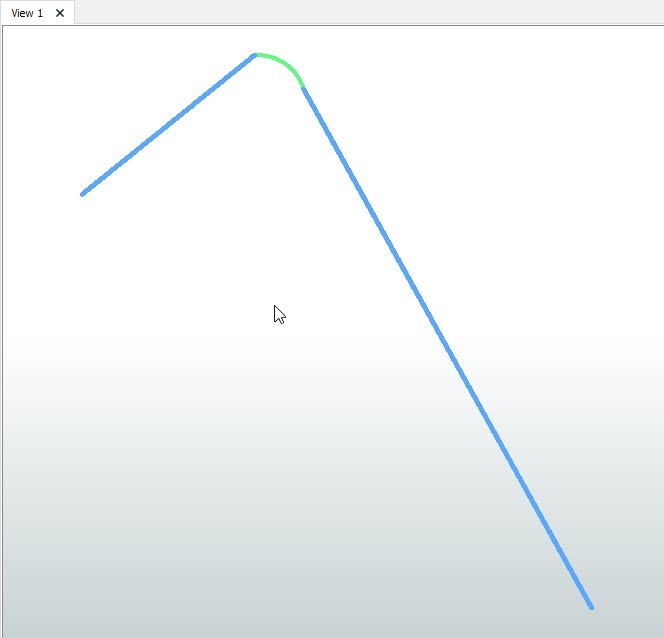
@datanomad the CurveFitter (which is an extra cost plugin) might also accomplish this for you. In your example above it would return three segments in the path:
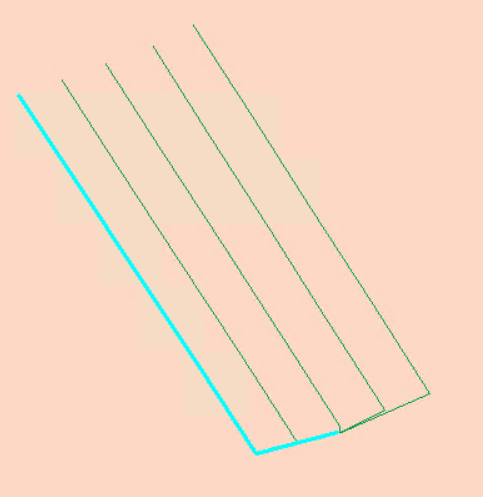
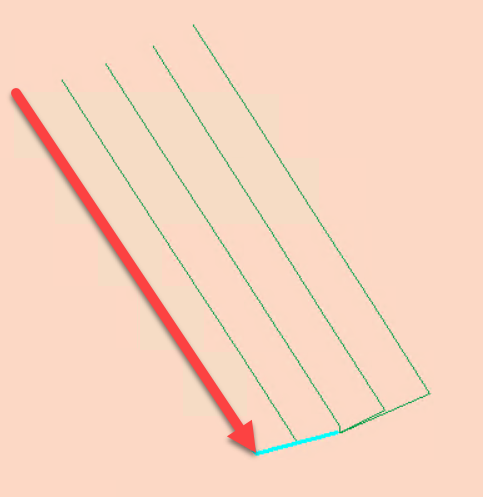
which look like:
Contact info@safe.com if you want to evaluate the CurveFitter.
daveatsafe (Safer) @mark2atsafe (Safer) @markatsafe (Safer)
@Takashi Iijima
Thank you all for the suggestions. While testing some of the suggested processes and I am not able to fully replicate your results accordingly.
I am attaching the fmwt and some images. The red lines in the following images indicate what line should be kept as the final result, I am not able to replicate same as your have done, when applied to several data points.
Original Line:
What the processed final line should stop:
Another Original Line:
What the processed final line should stop:
-Adding @Takashi Iijima for additional ideas.
Just wanted to do a followup on the above post. Any ideas?
daveatsafe (Safer) @mark2atsafe (Safer) @markatsafe (Safer)
@datanomad Thanks for including the additional examples. I think the original responses were based on the single example you supplied, which is more of a continuous curve. The additional examples you have sent include both both curved lines as well as more 'angular' examples (with sharper break-points). For more difficult problems it is often useful to add some context to the data, so the community can understand the broader picture of what is trying to be accomplished.
I think you're probably going to have to come up with a hybrid approach - one for the curves and another for the straighter lines with sharp corners. I think the curved examples have been dealt with above.
Looking at the more straight lines, I think you might be able use the TopologyBuilder. The TopologyBuilder returns the angles of the lines entering each node. So you might be able to use this information to determine which segments are on a straight portion of the line and which nodes form an elbow or break-point.
example workspace attached (FME 2020.2)
@Mark Stoakes
Thanks for the step through.
Is there a way to read through lines and determine a straight line versus curved line.
*I am thinking the number of nodes, but then a long meandering line will also have many nodes which could easily be confused to mean such a line has a curved nature. So I guess that leads me to the second question of is it possible to also know when nodes are tightly packed, as this will be the true indicator for a line that is fast changing direction, right?
Just got an email in my inbox saying this wasn't solved. Not sure where all the other emails went for such an active question... :/
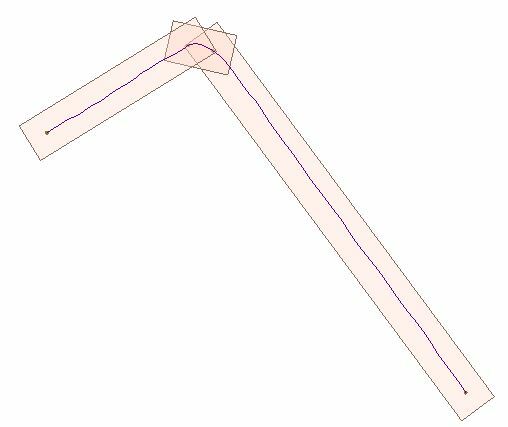
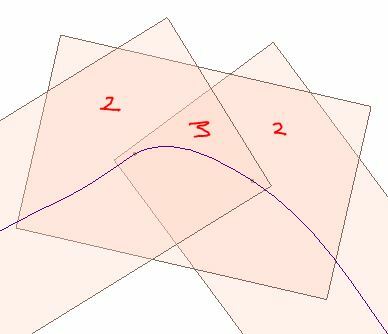
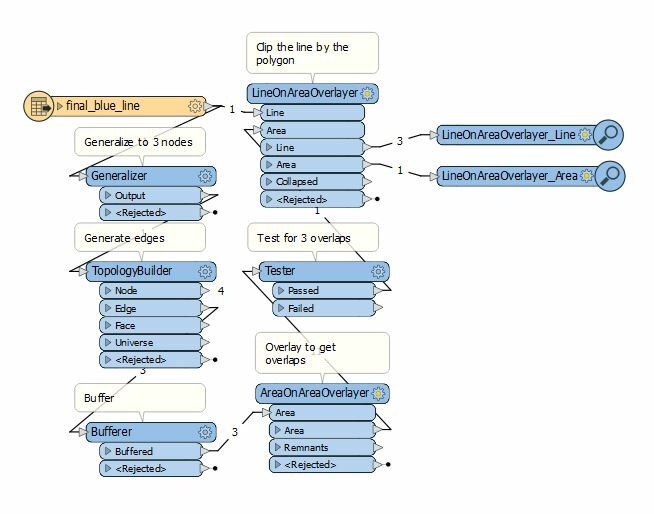
It's pretty simple, generalize the line into 3 nodes, buffer using square edges, and then clip by the 2nd vertex's buffer. You will create 3 polygons (fig1). One for each leg and one for the arc. You may need to buffer the result from the area on area to increase the size of the polygon for the line on area.
From there, anything with 3 overlaps is your polygon used to clip the line.
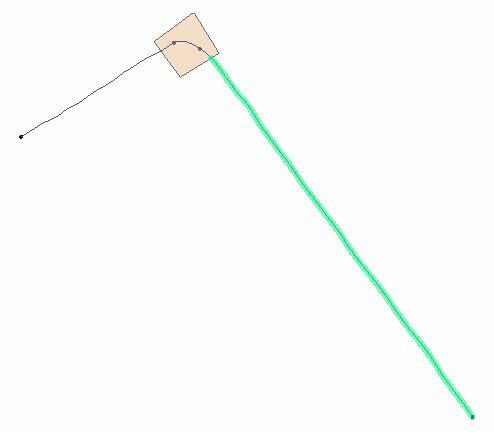
Resulting line on area overlay with clipped line
Workbench (attached fmwt)
Another thought would be; these are directional surveys. If you have the survey you can use the azimuth of the leg to query out the part of the line you want. They will all have the same azimuth range.
I actually made a workbench that maps the directional surveys from the raw survey. I used the polygon method above to isolate the lines in 3D like you are trying to do in 2D. It should be the same thought process.
See attached PPT. It's pretty nifty what FME can do.
Hope this helps in some way!
Yes indeed these are well laterals. I was testing out some concept ideas for something else I was working on, and decided to grab some public data just to see how they do perform. During my testing i came upon some issues and that was what led to my series of questions.
*Yes and Yes, you can use directional surveys and measures from raw survey, and I do actually have that process in place that uses raw data method.
So far I am liking your polygon overlap idea, I just need to test it on my particular sample data.
(where I can see it posing an issue is where you have series of laterals crossing each other, that might create polygons and create confusion)
If you feel like testing with me there is a dataset above TESTING_LINES for that purpose.
Thanks
@Mark Stoakes
Thanks for the step through.
Is there a way to read through lines and determine a straight line versus curved line.
*I am thinking the number of nodes, but then a long meandering line will also have many nodes which could easily be confused to mean such a line has a curved nature. So I guess that leads me to the second question of is it possible to also know when nodes are tightly packed, as this will be the true indicator for a line that is fast changing direction, right?
@datanomad I'll leave you to experiment with that. As you suggest, it's probably related to the number of nodes. VertexCounter
@datanomad the CurveFitter (which is an extra cost plugin) might also accomplish this for you. In your example above it would return three segments in the path:
which look like:
Contact info@safe.com if you want to evaluate the CurveFitter.
A not cost alternative to Curvefitter is Generalizer using the Douglas with Arc Fitting (Generalize) Algorithm - added in FME 2020.0
@Mark Stoakes
Will check it out. Thanks again.
Yes indeed these are well laterals. I was testing out some concept ideas for something else I was working on, and decided to grab some public data just to see how they do perform. During my testing i came upon some issues and that was what led to my series of questions.
*Yes and Yes, you can use directional surveys and measures from raw survey, and I do actually have that process in place that uses raw data method.
So far I am liking your polygon overlap idea, I just need to test it on my particular sample data.
(where I can see it posing an issue is where you have series of laterals crossing each other, that might create polygons and create confusion)
If you feel like testing with me there is a dataset above TESTING_LINES for that purpose.
Thanks
You can use the group by function because the buffers are derived from the same well ID.
For testing, I added an offset curve generator to the data to create some arcs. You may only need to use the generalizer. As you can see from the screenshot below, the generalization will typically set the point to the end of the shortest leg after the arc (roughly). Because the lateral is always the longest leg it should put the point where you need it. From there, you can use an anchored snapper to snap the generalized vertex to the original line and then use a point on line overlay to clip the line. Resulting in the leg split from the well path.
The most important thing, is getting the survey to 3 vertices I think. That's the key to this one.
Example: Curves w/ generalized line ending at end of arc
I can see in my head how to do it a few other ways if this doesn't work.