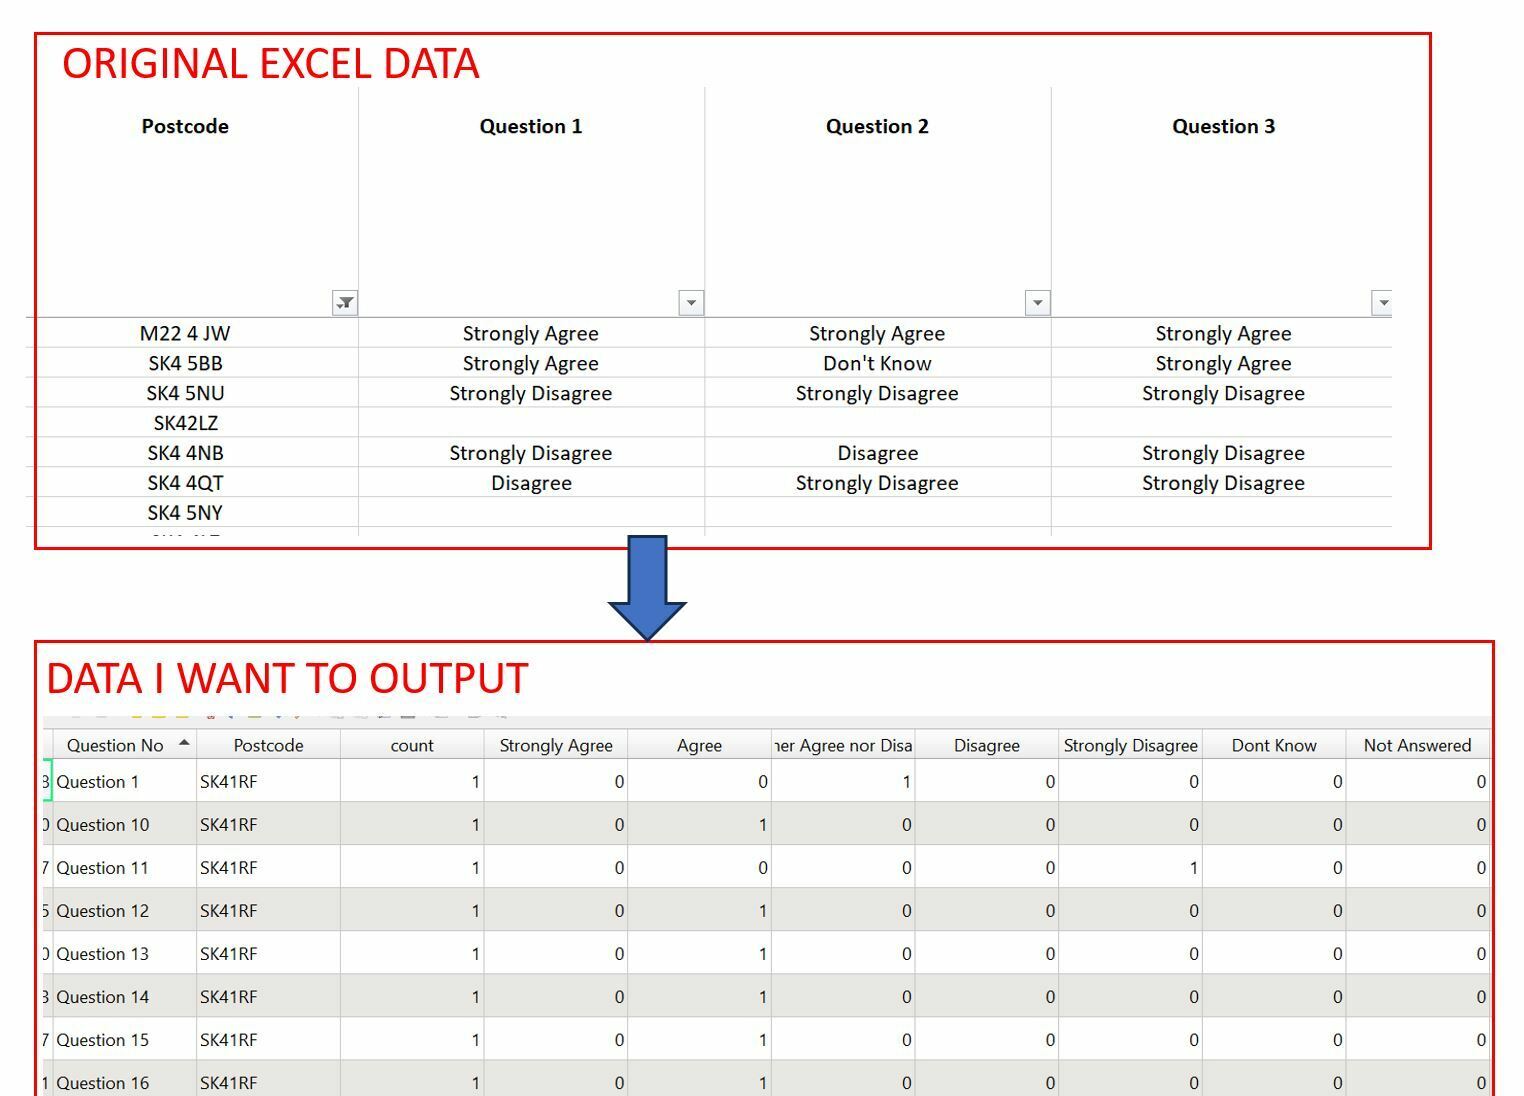
Morning, I am trying to transpose some data from a survey, I want to sort of Pair up the Postcode and the Question Number, then have columns of Responses with counts. Ive attached images  and a fme workbench of the original data and the output I want. I have 36 questions, so want to know if there is a way to do this using a list? So I dont have to repeat this 36 times, I am not understanding how to do lists!
I want to output the postcode as a column, then have a question number column. So each postcode will be repeated depending on the number of questions e.g.

Question No    Postcode

Question 1      M19 4NY

Question 2     M19 4NY

Question 1      M4 7AT

Question 2     M4 7AT


Then I want the next columns to be counts of the answers

Question No    Postcode  Strongly Agree      Agree      Neither    Disagree     Strongly Disagree

Question 1      M19 4NY             2                         3               1               0                      2

Question 2     M19 4NY             5                         7               0                3                      0

Question 1      M4 7AT             1                          2                1               5                       6

Question 2     M4 7AT               3                         4                 1              4                       4
 

@sar_copp Is this question still open?

I think your data looks pretty good for an excel pivot table to get the results you want.

But this will give the result in fme:


@sar_copp Is this question still open?

I think your data looks pretty good for an excel pivot table to get the results you want.

But this will give the result in fme:


I am indeed looking for the answer - my excel screen print was just an illustration of what I need, havent managed to achieve it. Will look at what yo’ve done


Reply