Hi,
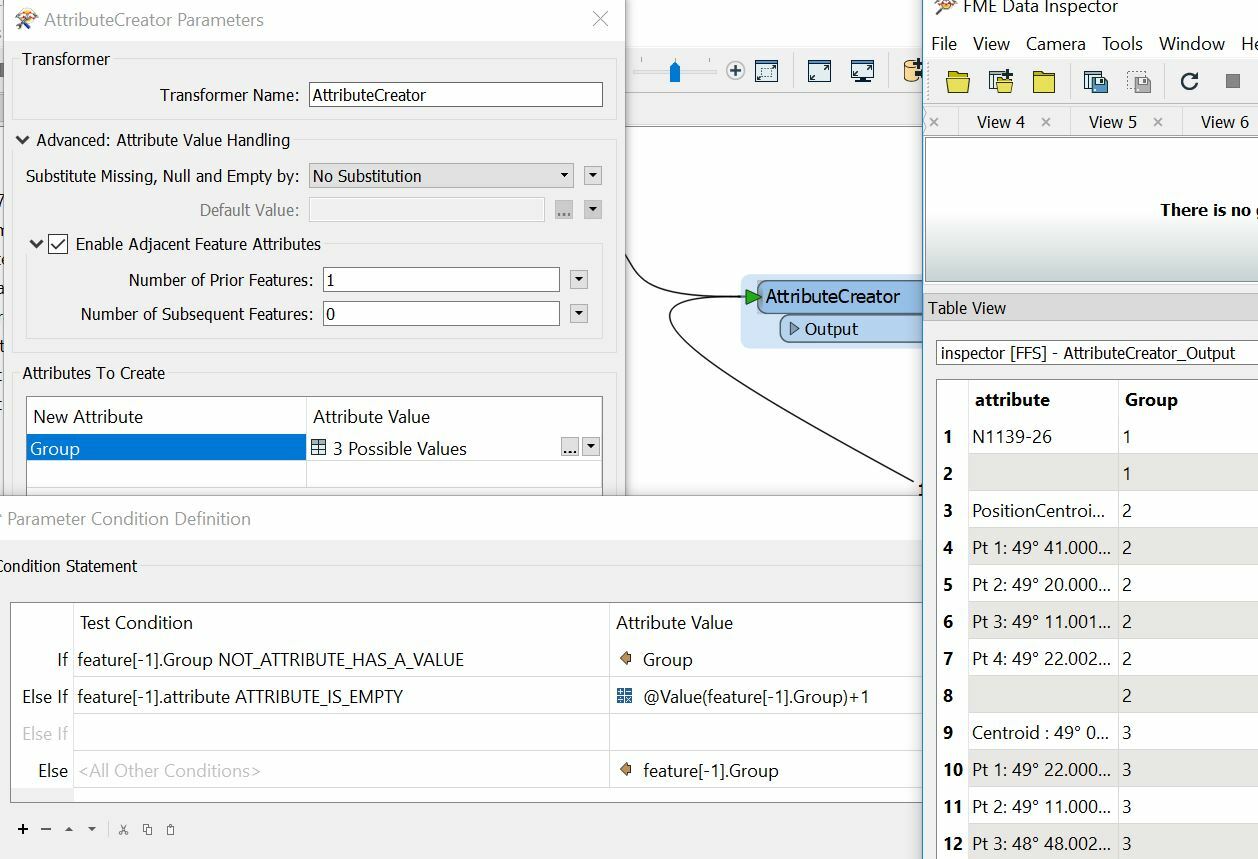
I have a multi-columns table with the first column contsing the Record Id and decription of the polygon. Each record can have one or more polygons in the description where each group is separated by blank lines as shown.
N1139-26
PositionCentroid : 49° 24.230'N 064° 33.127'W
Pt 1: 49° 41.000'N 065° 00.000'W
Pt 2: 49° 20.000'N 065° 00.000'W
Pt 3: 49° 11.001'N 064° 00.005'W
Pt 4: 49° 22.002'N 064° 00.005'W
Centroid : 49° 05.088'N 063° 29.568'W
Pt 1: 49° 22.000'N 064° 00.000'W
Pt 2: 49° 11.000'N 064° 00.000'W
Pt 3: 48° 48.002'N 063° 00.005'W
Pt 4: 49° 00.002'N 063° 00.005'W
I am able to extract the coordinates and plot the points. However I am unable to group the points to form proper polygons. Without grouping properly, they form zigzag lines.
The table consists of hundreds of similar records. Can anyone suggest how to plot these correctly.
Thanks.


