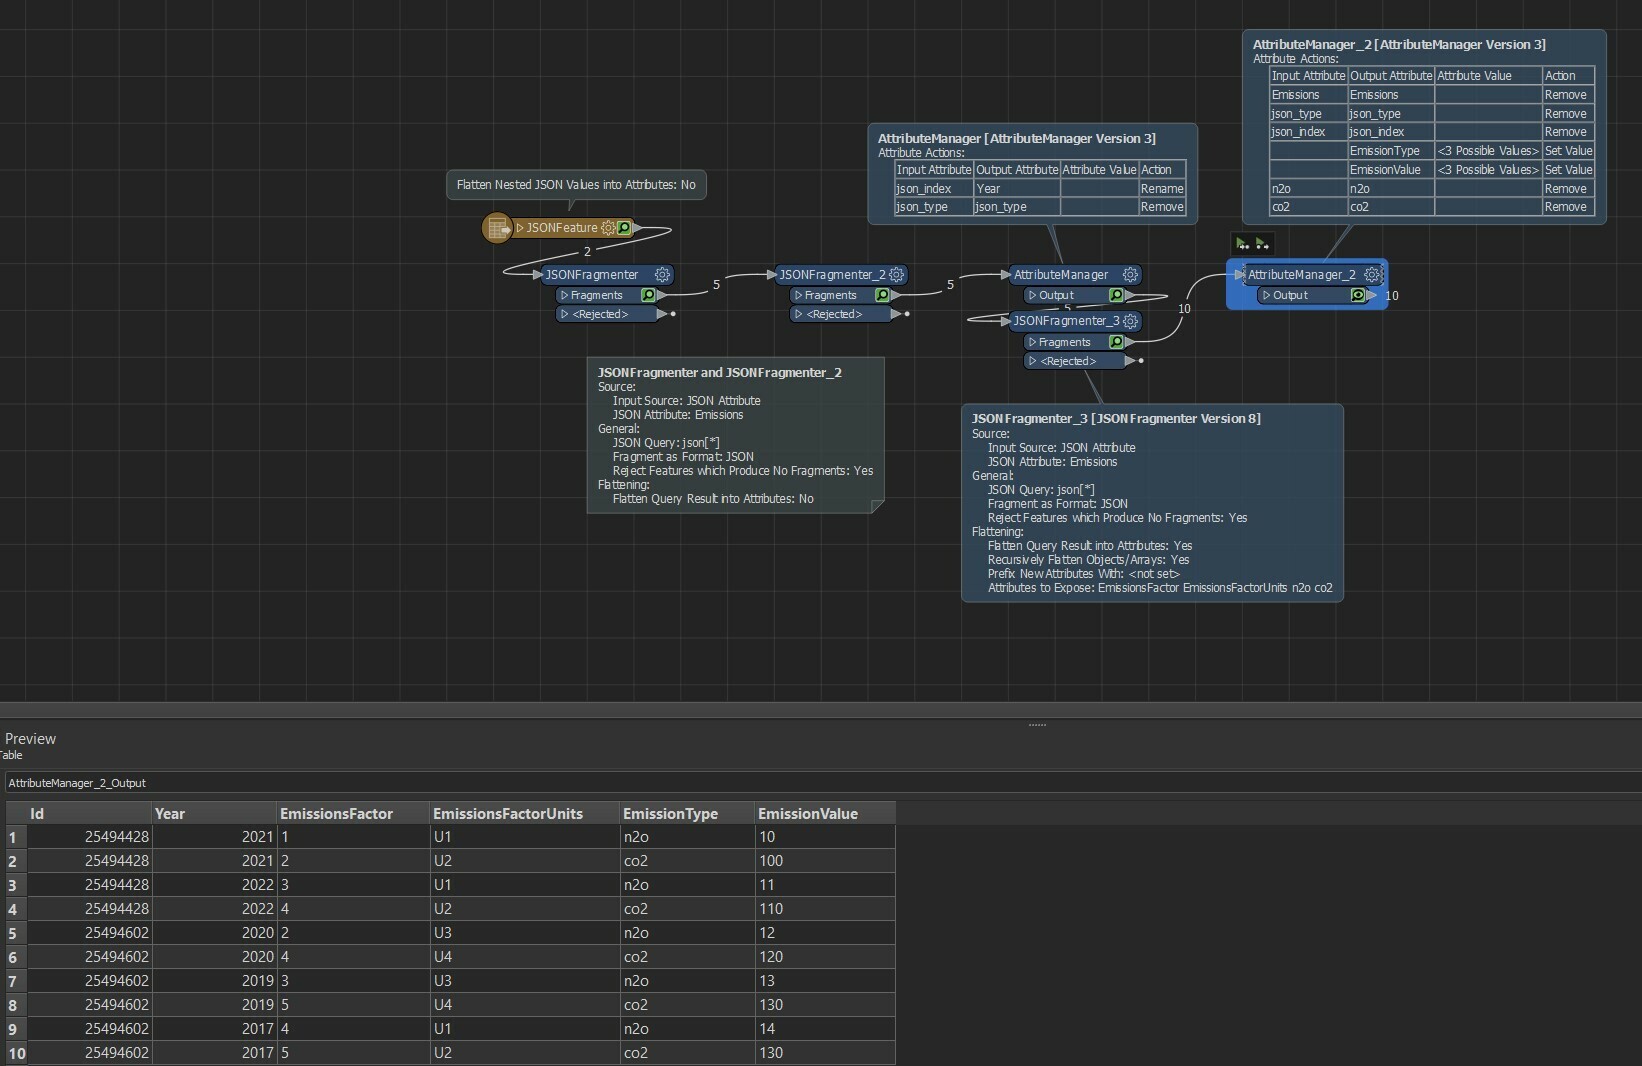
I have this json file (see the attached txt file) that I want to load into a table (shown as in the attached excel file). I have done many json conversions over the years, but this one puzzled me quite a bit and could not figure out a good way to do it. The difficult part is that for each asset Id, there could be a few years of emissions. Each emission has two emission type, n2o and co2. How can I capture each year and its emissions into rows based on the emission type to be pivoted?
{
"assets": [
{
"Id": 25494428,
"Emissions": [
{
"2021": [
{
"EmissionsFactor": 1,
"EmissionsFactorUnits": "U1",
"n2o": 10
},
{
"EmissionsFactor": 2,
"EmissionsFactorUnits": "U2",
"co2": 100
}
]
},
{
"2022": [
{
"EmissionsFactor": 3,
"EmissionsFactorUnits": "U1",
"n2o": 11
},
{
"EmissionsFactor": 4,
"EmissionsFactorUnits": "U2",
"co2": 110
}
]
}
]
},
{
"Id": 25494602,
"Emissions": [
{
"2020": [
{
"EmissionsFactor": 2,
"EmissionsFactorUnits": "U3",
"n2o": 12
},
{
"EmissionsFactor": 4,
"EmissionsFactorUnits": "U4",
"co2": 120
}
]
},
{
"2019": [
{
"EmissionsFactor": 3,
"EmissionsFactorUnits": "U3",
"n2o": 13
},
{
"EmissionsFactor": 5,
"EmissionsFactorUnits": "U4",
"co2": 130
}
]
},
{
"2017": [
{
"EmissionsFactor": 4,
"EmissionsFactorUnits": "U1",
"n2o": 14
},
{
"EmissionsFactor": 5,
"EmissionsFactorUnits": "U2",
"co2": 130
}
]
}
]
}
]
}


