Hi,
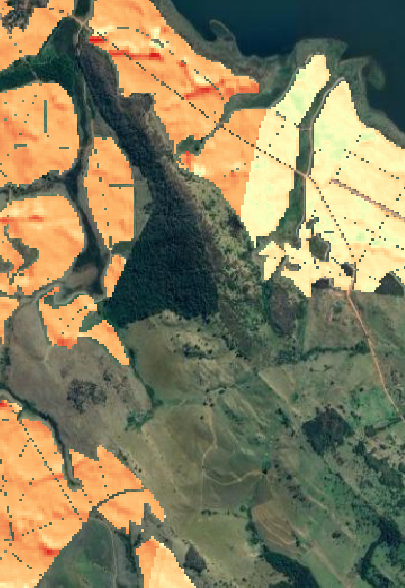
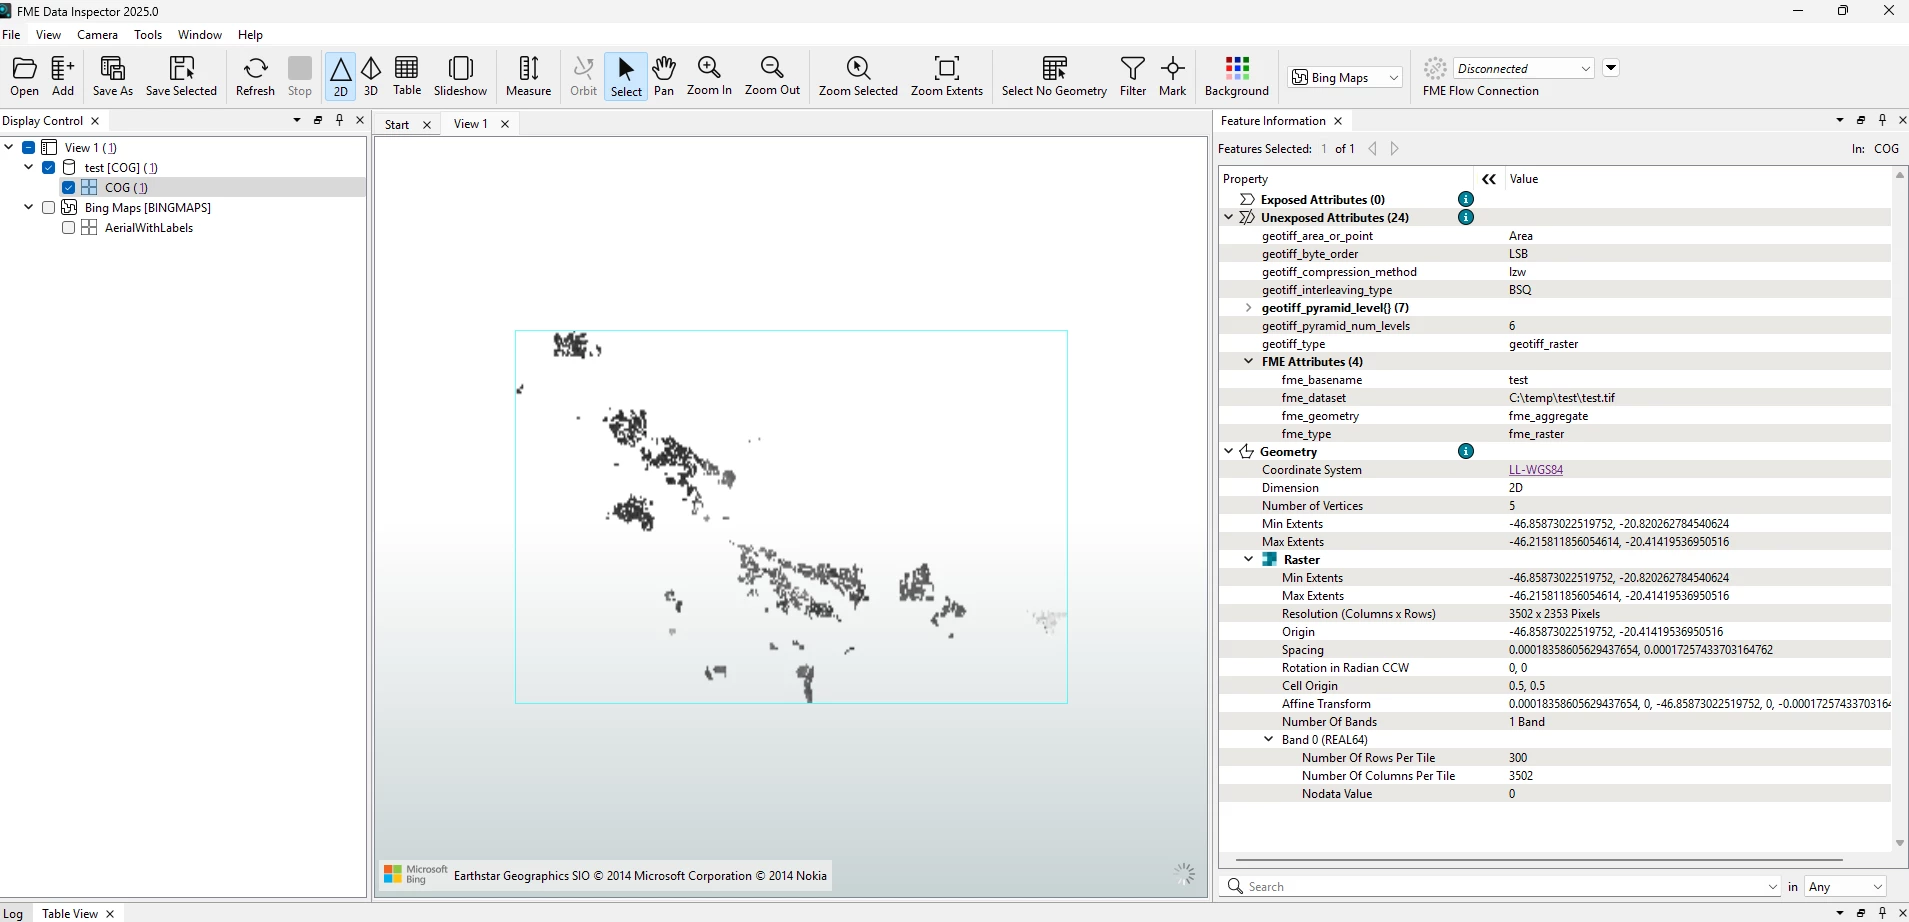
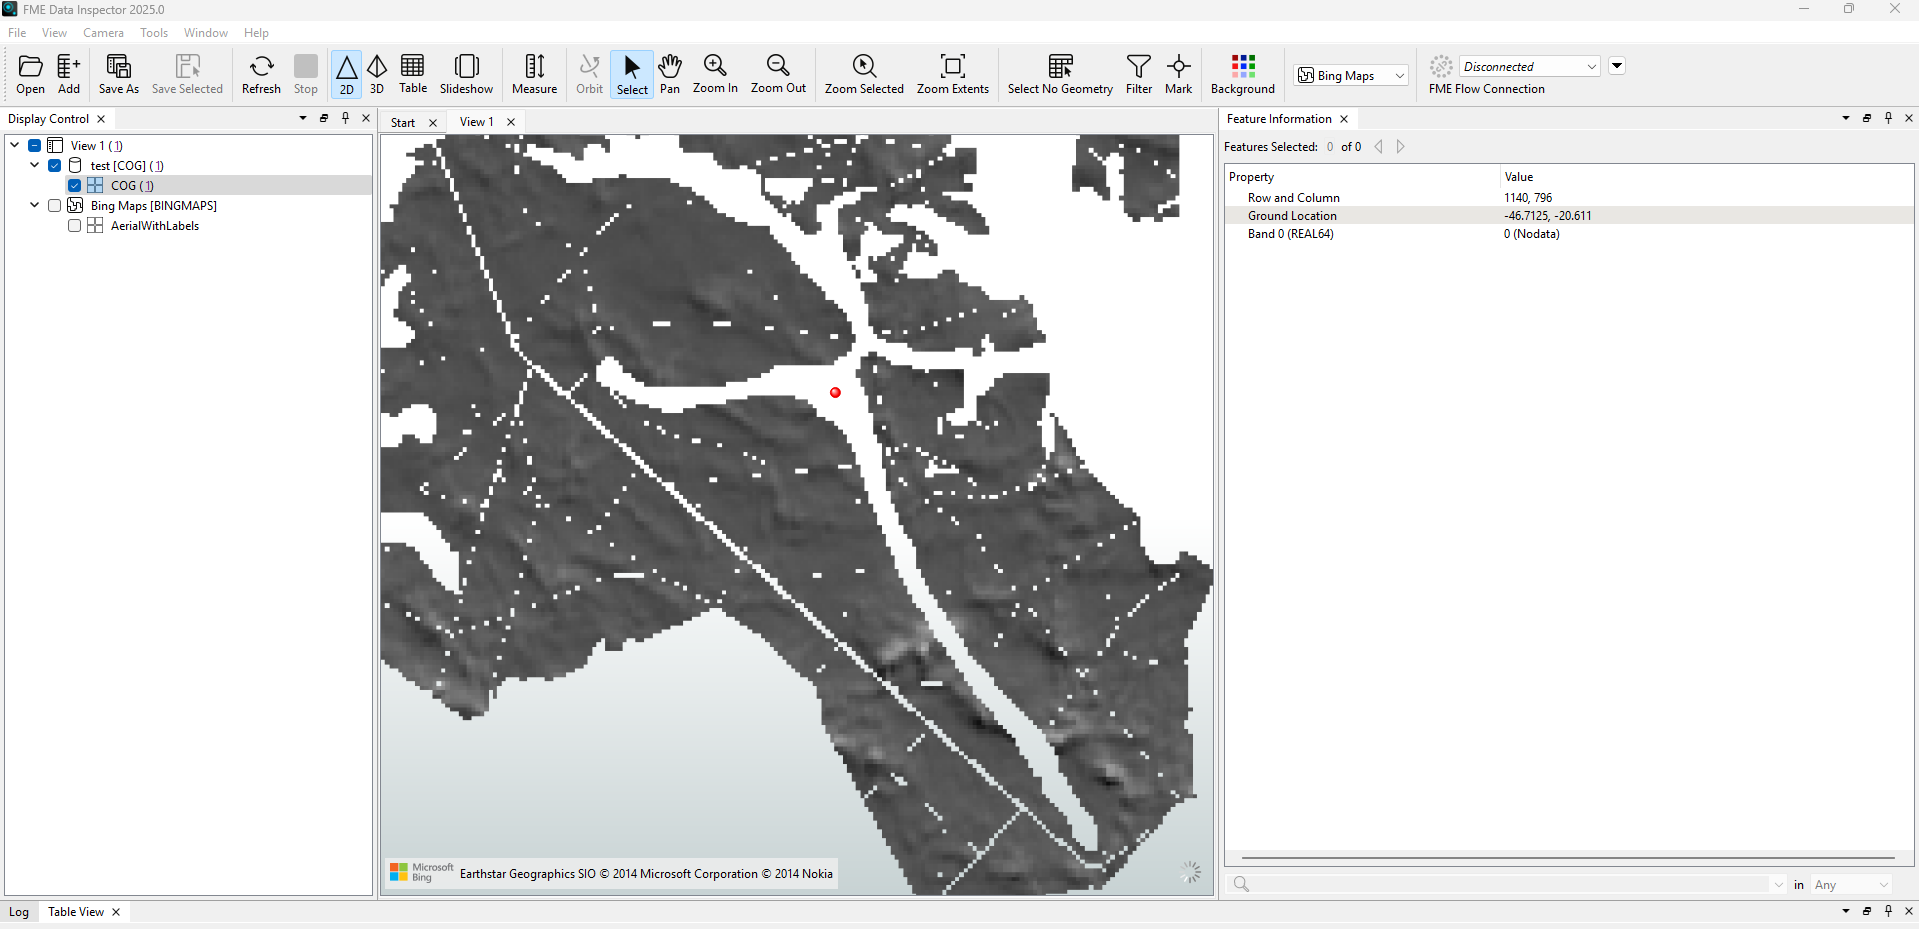
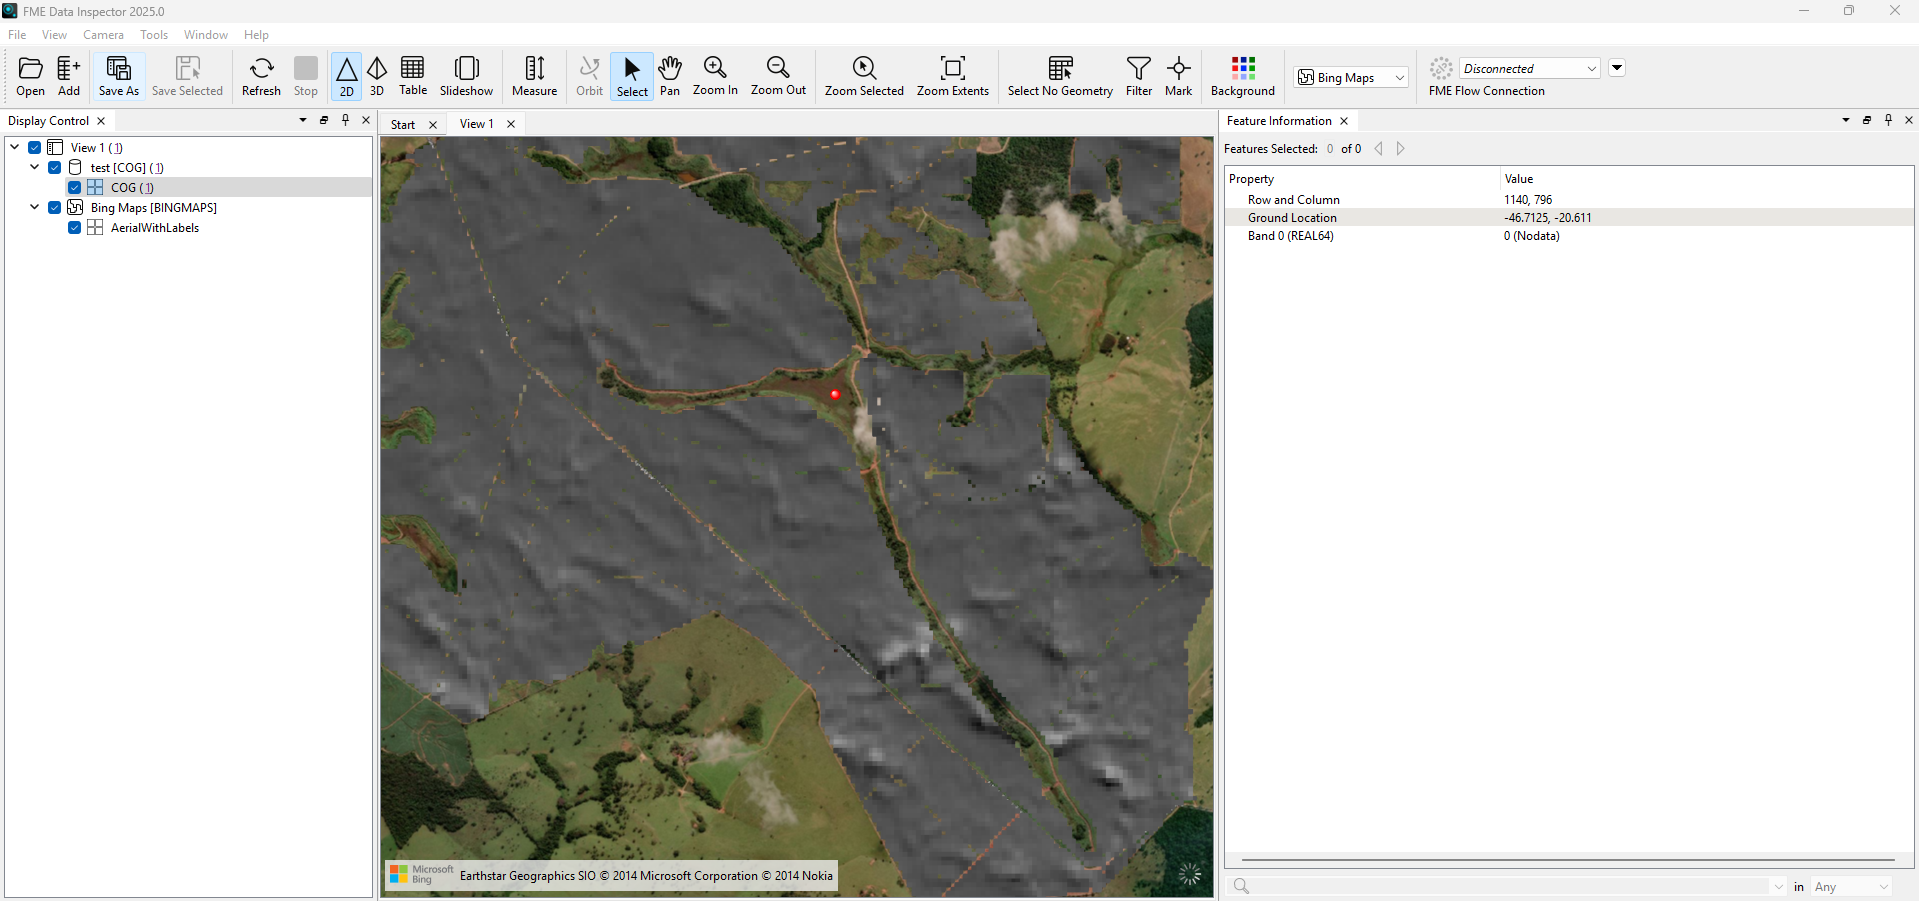
I have a raster file (attached), and I would like to convert it into a 3D representation, similar to the image below.
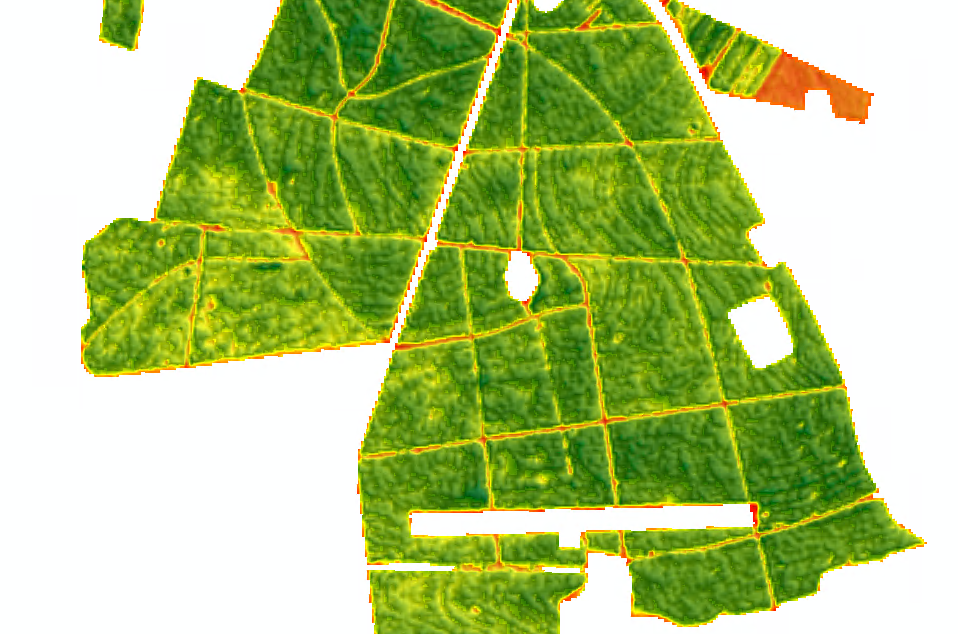
How can I do that?
Thank´s


 +9
+9Hi,
I have a raster file (attached), and I would like to convert it into a 3D representation, similar to the image below.
How can I do that?
Thank´s
Enter your E-mail address. We'll send you an e-mail with instructions to reset your password.